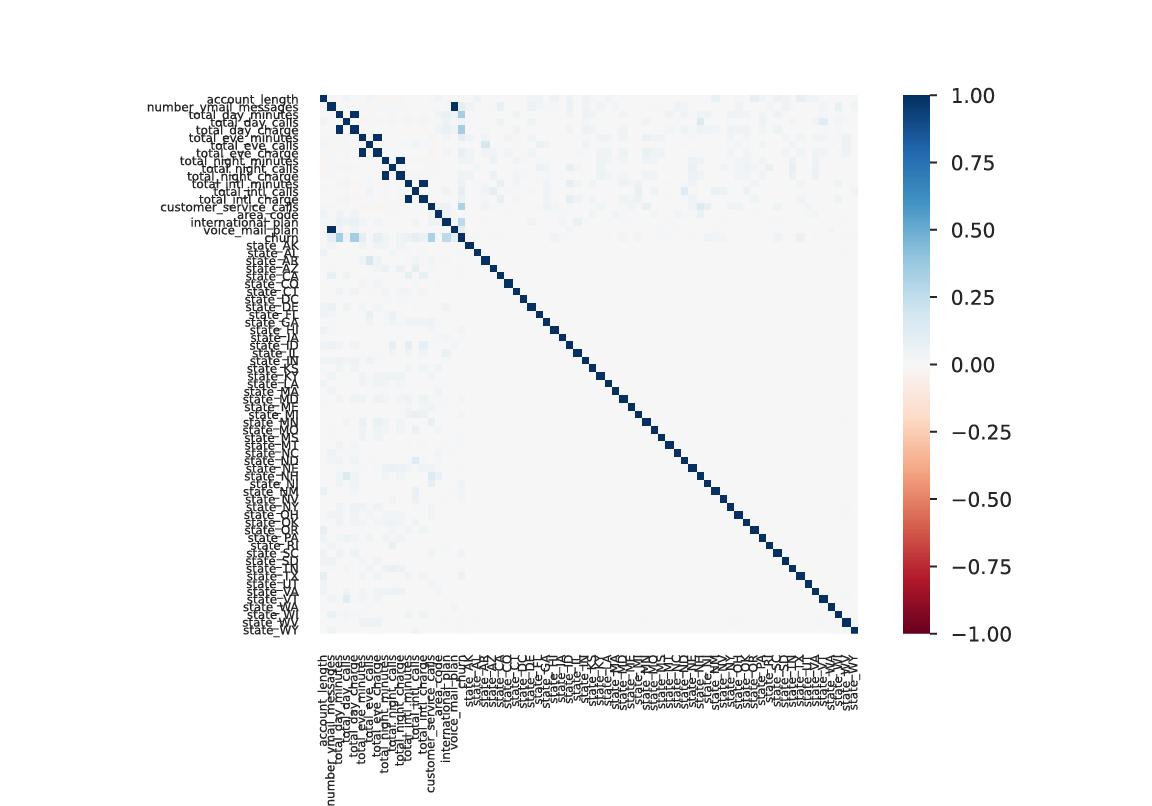
import warnings
from statsmodels.tools.sm_exceptions import ValueWarning
warnings.filterwarnings("ignore")
warnings.simplefilter(action="ignore", category=UserWarning)
warnings.simplefilter(action="ignore", category=FutureWarning)
warnings.simplefilter('ignore', ValueWarning)
# Interactive plots embedded within the notebook
#%matplotlib notebook
# Static images of plots embedded within the notebook
%matplotlib inline
%config InlineBackend.figure_formats = {'png', 'retina'}
from IPython.core.interactiveshell import InteractiveShell
InteractiveShell.ast_node_interactivity = "all"
import pandas as pd
churn_df = pd.read_excel('data/tree-based.xlsx', sheet_name='CHURN')
churn_df
churn_df.info()
churn_df.describe(include='all')

df = churn_df.copy()
df.dropna(inplace=True)
if 'phone_number' in df:
df.drop(columns=['phone_number'], inplace=True)
if 'state' in df:
df.drop(columns=['state'], inplace=True)
if 'area_code' in df:
df.drop(columns=['area_code'], inplace=True)
international_plan_cat = ['no', 'yes']
if df['international_plan'].dtype == "object":
df['international_plan'] = df['international_plan'].apply(lambda x: international_plan_cat.index(x))
voice_mail_plan_cat = ['no', 'yes']
if df['voice_mail_plan'].dtype == "object":
df['voice_mail_plan'] = df['voice_mail_plan'].apply(lambda x: international_plan_cat.index(x))
df['churn'] = df['churn'].astype(int)
X = df.drop('churn', axis=1)
Y = df[['churn']]
from sklearn.model_selection import train_test_split
X_train, X_test, y_train, y_test = train_test_split(X, Y, test_size=0.3)
from sklearn.tree import DecisionTreeClassifier
dt_clf = DecisionTreeClassifier()
dt_clf.fit(X_train, y_train)
from sklearn.metrics import f1_score
f1_score(y_test, dt_clf.predict(X_test))
from sklearn.metrics import classification_report
print(classification_report(y_test, dt_clf.predict(X_test)))
from sklearn.metrics import confusion_matrix
confusion_matrix(y_test, dt_clf.predict(X_test))
from sklearn import tree
text_representation = tree.export_text(dt_clf, feature_names=list(X_train.columns))
print(text_representation)
import graphviz
from sklearn import tree
dot_data = tree.export_graphviz(dt_clf, out_file=None,
feature_names=X.columns,
class_names=churn_df['churn'].unique().astype(str), impurity=False,
filled=True, rounded=True, proportion=True)
# Draw graph
graph = graphviz.Source(dot_data, format='png', filename="UntunedModel.gv")
graph

feature_list = pd.DataFrame({'feature': X.columns, 'value': dt_clf.feature_importances_})
feature_list_sorted = feature_list.sort_values('value')
feature_list_sorted
import matplotlib.pyplot as plt
plt.figure(figsize=(7, 3))
plt.barh(range(0, len(feature_list_sorted.index)),
feature_list_sorted.value, tick_label=feature_list_sorted.feature)
plt.tight_layout();
from sklearn.tree import DecisionTreeClassifier
from sklearn.model_selection import GridSearchCV
tree_para = {
"criterion": ["gini", "entropy", "log_loss"],
"max_depth": [5, 8, 9, 10, 11, 12],
"max_features": ["auto", "sqrt", "log2"],
"splitter": ["random", "best"],
}
dt_gridsearch = GridSearchCV(DecisionTreeClassifier(), tree_para, scoring="f1")
dt_gridsearch.fit(X_train, y_train)
# Sort scores
pd.DataFrame(dt_gridsearch.cv_results_).sort_values('mean_test_score', ascending=False)
dt_gridsearch.best_params_ # Tuned hyperparameters
dt_gridsearch.best_score_ # Best score
dt_gridsearch.best_estimator_ # Tuned model
dt_clf_tuned = dt_gridsearch.best_estimator_
from sklearn.tree import DecisionTreeClassifier
from sklearn.model_selection import cross_validate
scoring_metrics = ["accuracy", "precision_macro", "recall_macro", "f1_macro", "f1"]
score_tuned = cross_validate(
dt_clf_tuned,
X,
Y,
scoring=scoring_metrics,
cv=5,
return_train_score=False,
)
scores_tuned_df = pd.DataFrame(score_tuned)
scores_tuned_df
scores_tuned_df.mean()
scores = cross_validate(
dt_clf,
X,
Y,
scoring=scoring_metrics,
cv=5,
return_train_score=False,
)
scores_df = pd.DataFrame(scores)
scores_df
scores_df.mean()
dot_data_tuned = tree.export_graphviz(dt_clf_tuned, out_file=None,
feature_names=X.columns,
class_names=churn_df['churn'].unique().astype(str), impurity=False,
filled=True, rounded=True, proportion=True)
# Draw graph
graph_tuned = graphviz.Source(dot_data_tuned, format='png', filename="TunedModel.gv")
graph_tuned
