"The Great Barrier Reef is in grave danger. The twin perils brought by climate change – an increase in the temperature of the ocean and in its acidity – threaten its very existence.” - Sir David Attenborough
Our primary dataset for this project was Global Coral-Bleaching Database (GCBD), which contains measurements from reef sites across the world taken by 7 different research organizations/projects between 1980-2020. We supplemented this with data from the World Bank’s World Development Indicators (WDI) to include features on fishing and agriculture, as well as data from the Marine Ecoregions of the World (MEOW) to include features on the ecological region of the reef sites. GCBD and WDI are covered by the Creative Commons Attribution 4.0 license, while MEOW is public for non-commercial use with attribution. A data dictionary of evaluated features can be found in Appendix E.
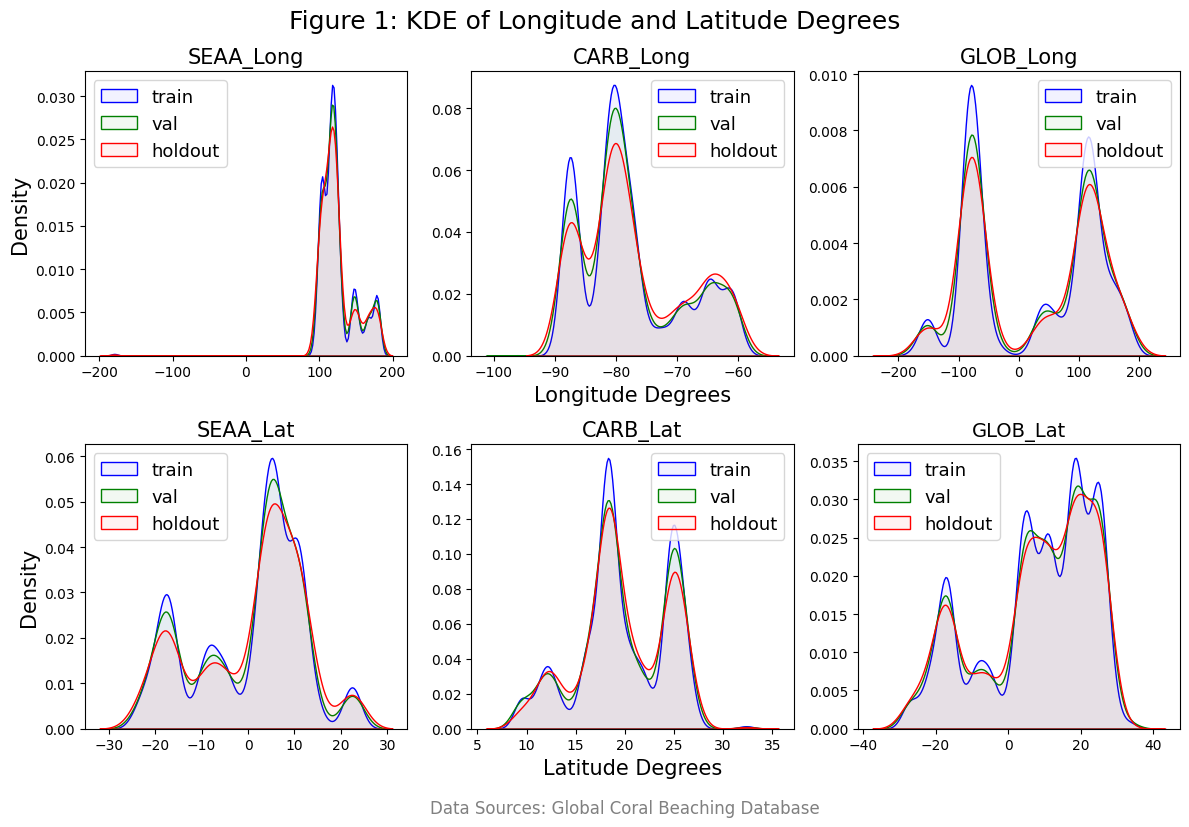
In efforts to clean our data we restricted our analysis to 1998-2020, as there appeared to be an issue of selection bias in measurements pre-1998 where the majority of reef sites surveyed showed high levels of bleaching. We also limited our investigation to hard corals, as not all soft corals exhibit the same symbiotic relationship with algae [5].
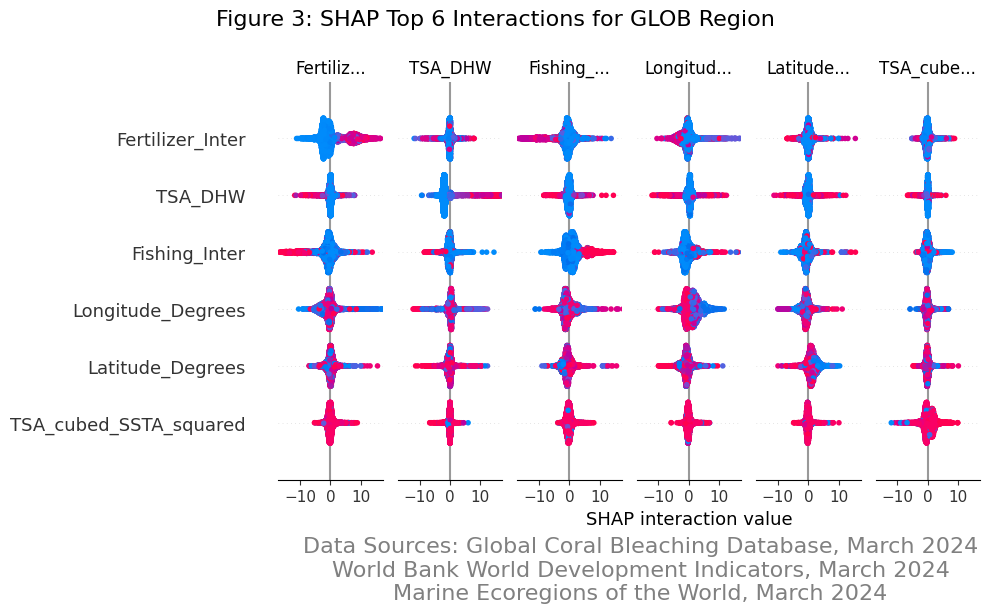
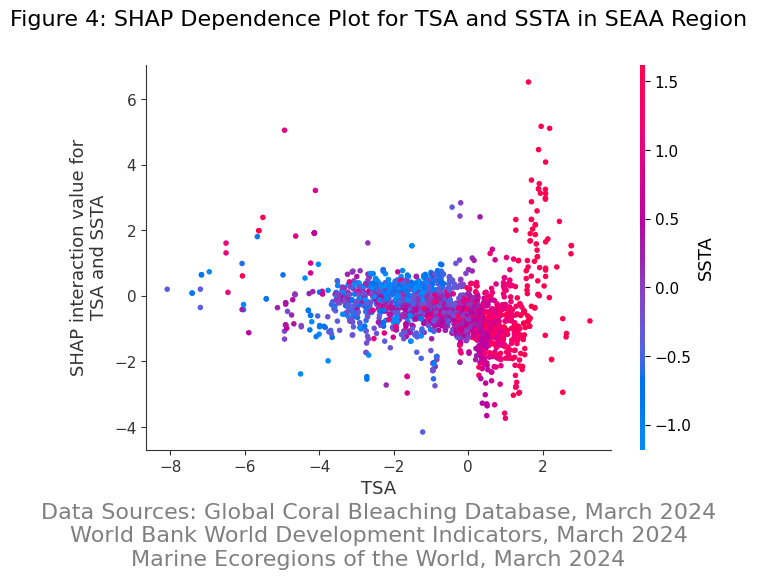
We explored various methods to select and reduce our feature set to improve our models performance including Principal Component Analysis, Variance Inflation Factor Analysis, Shapley Additive Explanations to understand interaction variables, and a robust feature selection process.
Since our cleaned dataset contained more than 90 features, we decided to perform a PCA analysis, thinking it might be useful in reducing the dimensionality of the dataset by providing latent features.
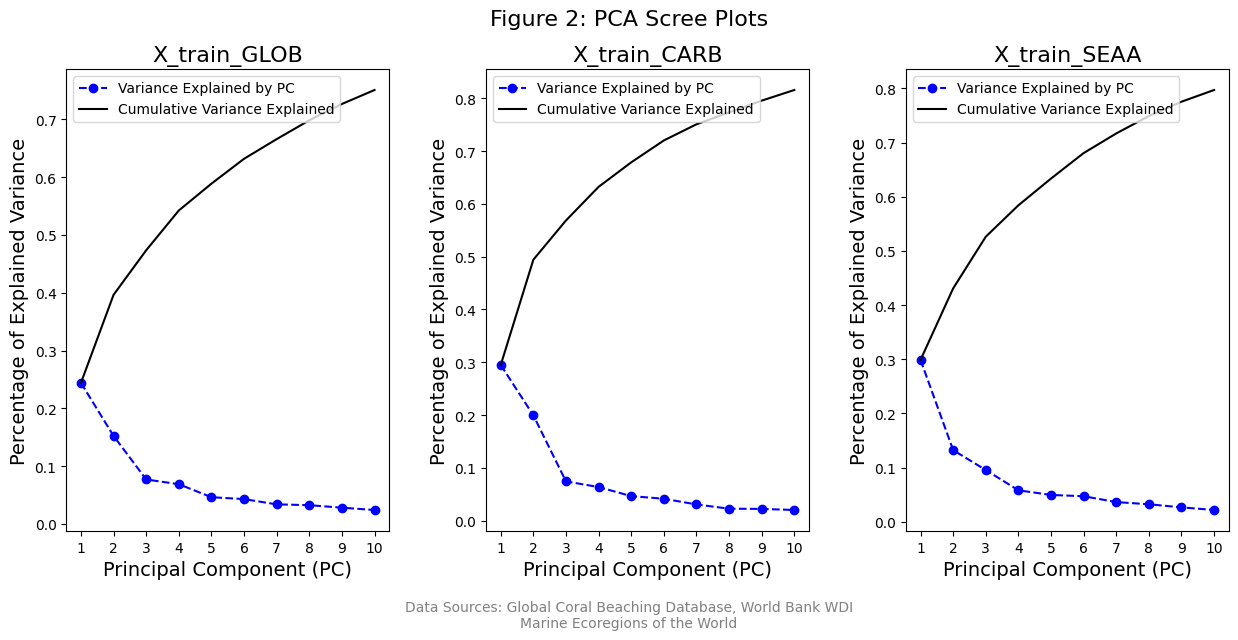
The “elbow” of the Scree plots (Fig. 2) all lined up with the first 3 principal components and account for approximately 50% of the total explained variance. We determined that in order to retain a majority of the explained variance, we needed to retain almost all of the original features, indicating each feature was already linearly independent. Based on this we looked to other methods to help reduce the feature space.
One aspect of our data that could lead to difficulties in interpretability is potential multicollinearity of the features. With highly multicollinear data, it is difficult to attribute the contributions of specific features. Initial testing with Variance Inflation Factor (VIF) indicated a massive degree of multicollinearity within the 57 continuous features that comprised the dataset, especially around the WDI data. After reducing the dataset to basic weather, fishing, and fertilizer related features, the VIF scores for the remaining 17 features were 5 or lower, indicating an acceptable degree of multicollinearity, with a loss of only 0.3 MAE when compared to the full dataset using an unoptimized XGBoost model.