Empirical Project - Determining a Correlation between Mergers and Consumer Prices as well as Market Concentration and Innovation
Clayton Malone and Jack Lindley
1. Introduction:
In the dynamic landscape of global economics, the interplay between mergers, consumer prices, market concentration, and innovation stands as a complex and multifaceted puzzle. Our research endeavors to dissect this intricate relationship, focusing on two pivotal areas: the impact of major mergers on consumer prices and the connection between market concentration and innovation within industries.
At the core of our exploration lies the concern for consumer welfare, market efficiency, and the far-reaching policy implications associated with mergers. The potential consequences of mergers extend beyond the corporate level, delving into the realms of consumer detriment. With the increased market power often accompanying mergers, firms may wield the ability to elevate prices, reduce output, or compromise product quality which can all always harm consumers.
Efficiency in market dynamics, relies on the allocation of resources where they are most valued. However, monopolistic behaviors stemming from mergers threatens to distort this allocation, leading to potential losses in the broader economy. On the policy front, competition authorities globally scrutinize proposed mergers, with consumer prices serving as a critical metric among other factors. A more informed empirical understanding of this relationship can foster more informed policy decisions in the realm of antitrust and competition policies.
The significance of our inquiry is highlighted by its direct impact on everyday life. Major mergers in industries such as airlines, telecommunications, or technology resonate with a broad spectrum of individuals, making our exploration inherently relatable and of immediate concern. The interest in our questions lies not only in the inevitability of encountering the effects of a major merger but also in the many different outcomes these mergers may yield.
Shifting our focus to market concentration and innovation, our investigation depends on three pivotal areas. First and foremost is the nexus between market concentration and technological progress which is a crossing that is very important for long-term economic growth and advancement. Understanding how market concentration influences innovation is paramount, given the potential repercussions for broader societal progress.
Diving into the realm of business strategy, our project aims to unravel the intricate decision-making processes of firms regarding investments in research and development (R&D). By deciphering the influence of market structure on such decisions, our research contributes valuable insights that can inform strategic choices for businesses operating within concentrated markets.
On the policy front, our exploration anticipates unraveling the implications of market concentration on innovation. A concentrated market discouraging innovation might create the need for a more demanding regulatory approach, whereas an environment fostering innovation due to concentration could merit a more lenient position.
The series of connections between market concentration and innovation fuels an ongoing debate, with different views on whether dominant firms possess less incentives to innovate or, conversely, have greater resources for substantial R&D investments. This debate gains a spotlight when looking at the tech industry, where a handful of dominant players shape the narrative. Our project aims to shed light on this contentious relationship, offering insights that go beyond industry boundaries and extend into the future path of one of the most influential sectors in modern economies.
In essence, our research covers the fundamental mechanics of markets, the decision-making processes of firms, and the pivotal role of policy in shaping outcomes. The real-world implications, combined with ongoing debates in both academic and policy realms, highlight the importance of our exploration. As we navigate the intricate landscape connecting mergers, consumer prices, market concentration, and innovation, our research aims to unravel insights that reach across sectors, industries, and the global economic landscape.
2. Data and Analysis:
2.1. Introduction:
This research paper investigates the critical dynamics of major mergers in specific industries and their impact on consumer prices, alongside examining the relationship between market concentration and the rate of innovation. The significance of this study lies in understanding the balance between market efficiency, consumer welfare, and the impetus for technological progress and economic growth. Our review of existing literature reveals diverse perspectives on the effects of mergers on market prices and innovation. While some studies suggest that mergers can lead to monopolistic behaviors, others highlight the efficiency gains and innovation boosts from such consolidations. We utilized a combination of datasets, including consumer price indexes and records of mergers and acquisitions in the tech industry. Our analysis involved creating interactive visualizations using Python to dynamically explore the relationship between these factors.
2.2. Results:
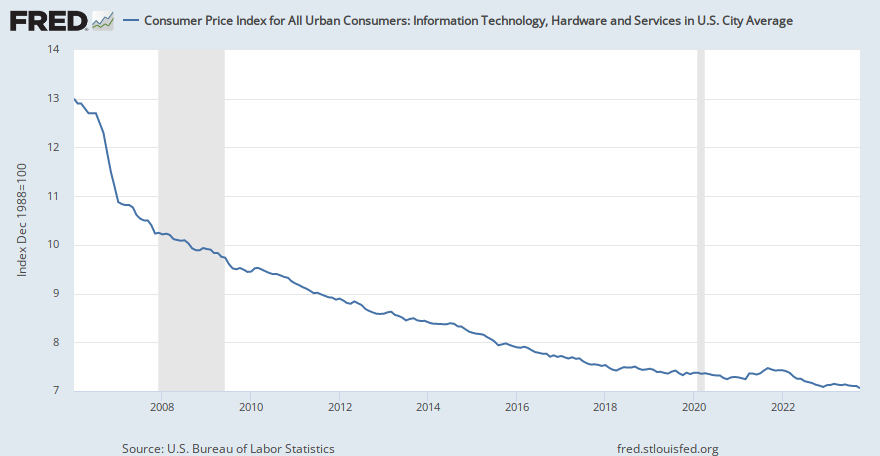
Graph 1: The Consumer Price Index (CPI) for Information Technology, Hardware, and Services reveals a downward trend, indicating decreased costs for tech-related goods and services. This aligns with the introduction's theme of mergers affecting consumer prices, as technological advancements, production efficiency, and market competition contribute to lower prices. However, the CPI trend alone doesn't capture quality enhancements or potential disruptions.
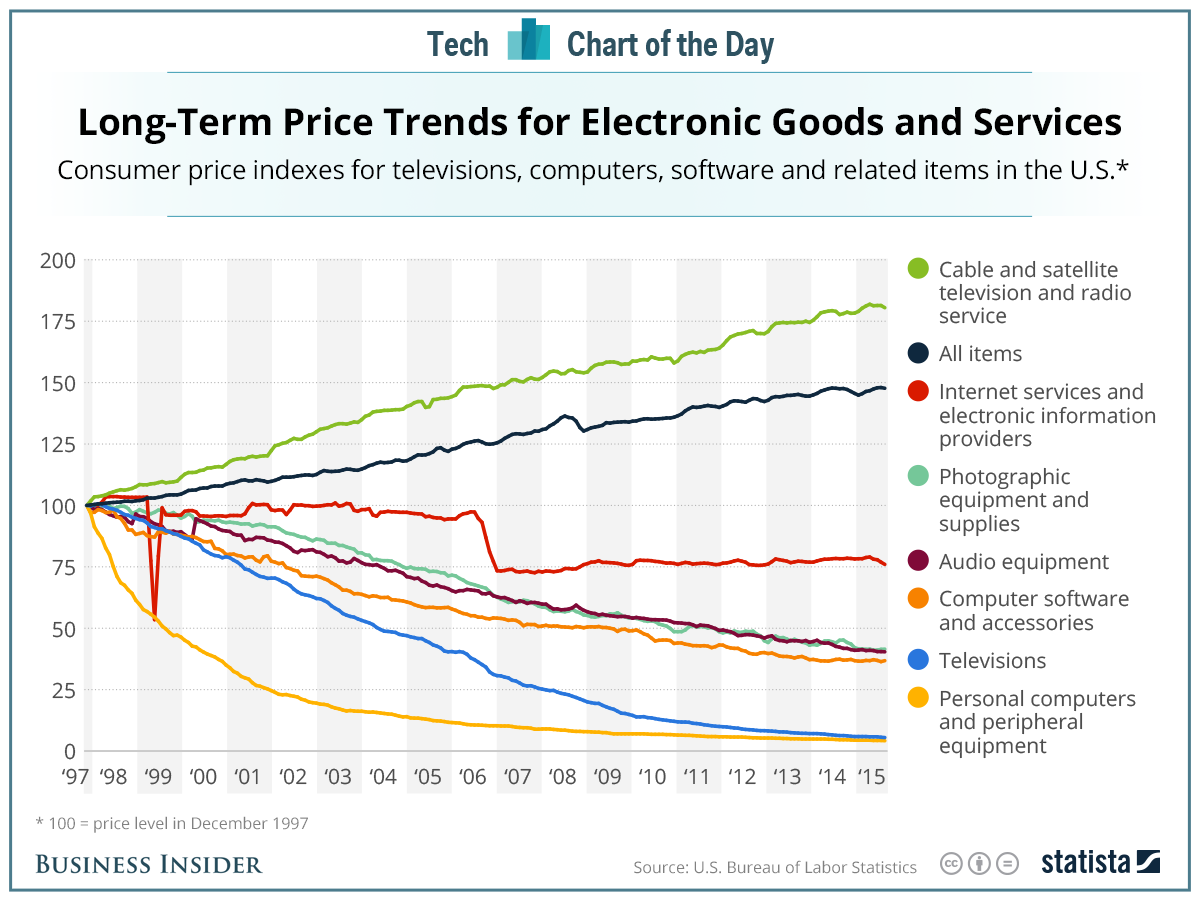
Graph 2: Long-term price trends for electronic goods and services exhibit significant decreases in hardware costs due to technological advancements, while services show potential inflation. This complexity in price behavior mirrors the intricate landscape discussed in the introduction, emphasizing the need to understand divergent trends within the tech sector.
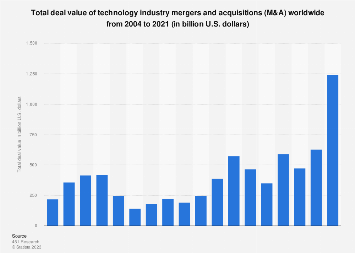
Graph 3: The trajectory of mergers and acquisitions (M&A) in the technology sector depicts increasing consolidation and investment. This aligns with the introduction's focus on mergers' implications, showcasing the tech industry's dynamic nature and reliance on M&A for growth and competitive advantages.
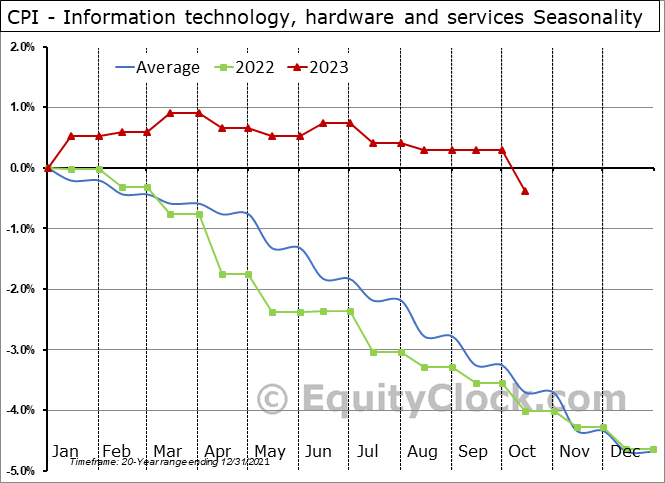
Graph 4: Seasonal trends in the CPI for Information Technology suggest a consistent pattern of declining prices throughout the year, influenced by factors like new product releases or seasonal sales. This reinforces the need for a comprehensive analysis, as seasonal variations can impact consumer decisions and industry performance.
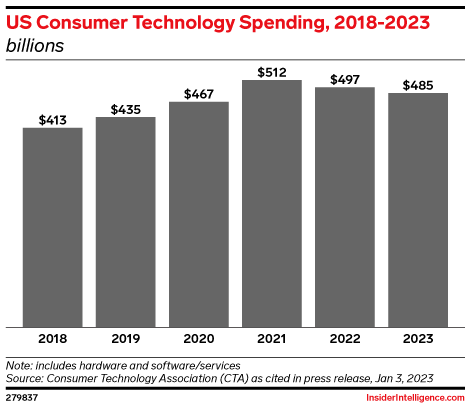
Graph 5: U.S. consumer technology spending indicates a peak in 2021 followed by a decline. This connects to the introduction's consideration of consumer spending patterns and business investments in response to mergers, market concentration, and innovation. The decline in spending may signal post-pandemic adjustments or changing economic conditions.
In essence, these graphs collectively enrich our understanding of the intricate landscape connecting mergers, consumer prices, market concentration, and innovation within the tech sector. They highlight the multifaceted dynamics shaping the industry and reinforce the necessity of a comprehensive analysis to unravel insights that go beyond sectors, industries, and the global economic landscape. The study underscores the complexity of antitrust and competition policies in balancing consumer welfare with the need for innovation and economic growth. Our findings contribute to the ongoing debate on the role of market concentration in driving technological progress, providing insights for both policymakers and business strategists.
2.3. Data and Where it Came From:
Interactive Graph 1:
Run to view results
Interactive Graph 2:
Run to view results
Graph 1: Consumer Price Index for All Urban Consumers: Information Technology, Hardware and Services in U.S. City Average. This data was obtained from Federal Reserve of Economic Data (FRED).
Run to view results
Graph 2: Long Term Price Trends for Electronic Goods and Services. This data was obtained from Business Insider.
Graph 3: Total Deal Value of Tech M&A. This data was obtained from statista.com.
Graph 4: CPI - Information technology, hardware and services seasonality. This data was obtained from equity clock.
Graph 5: US Consumer Technology Spending. This data was obtained from insiderintelligence.com.
2.4. Directed Acyclic Graph (DAG):
2.5. Expanded Analysis of Infographics:
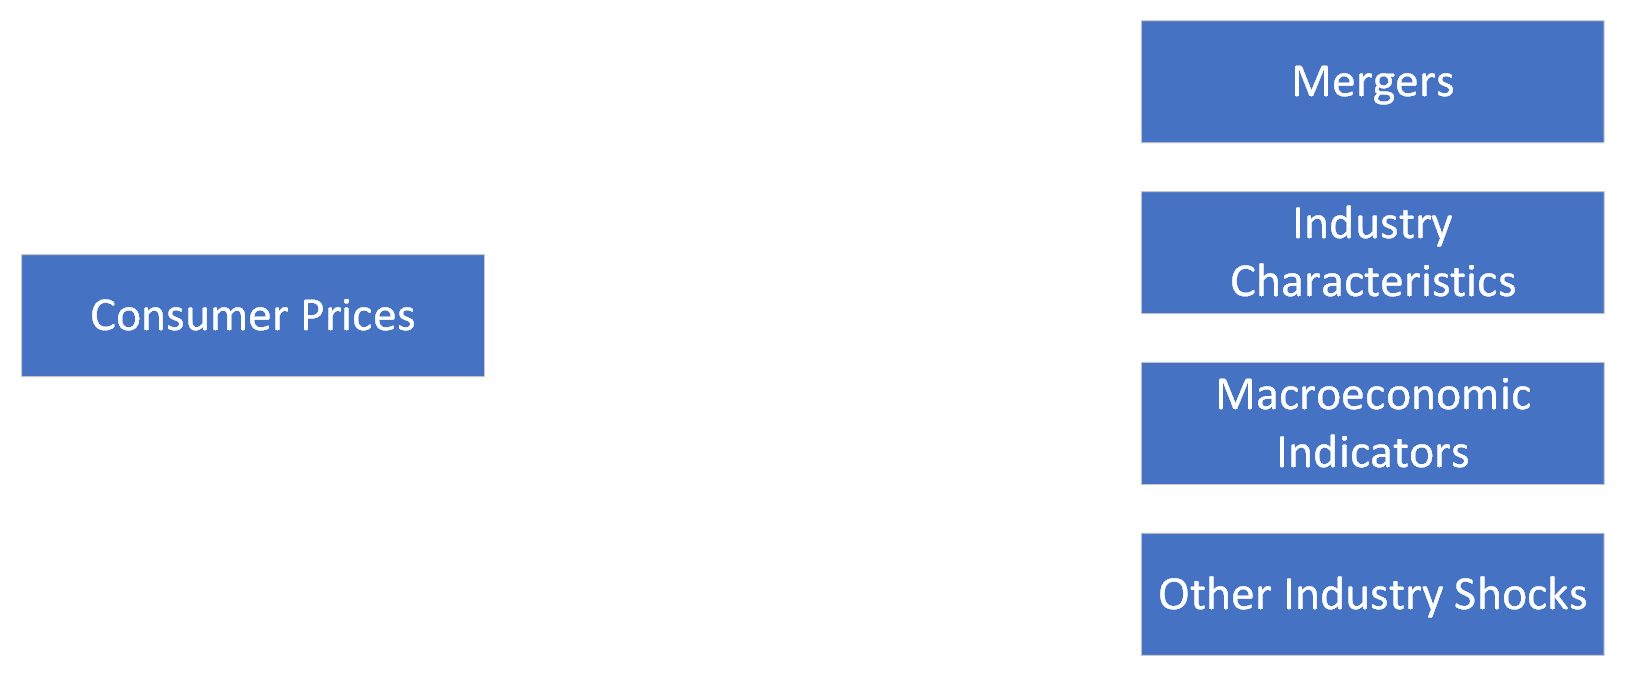
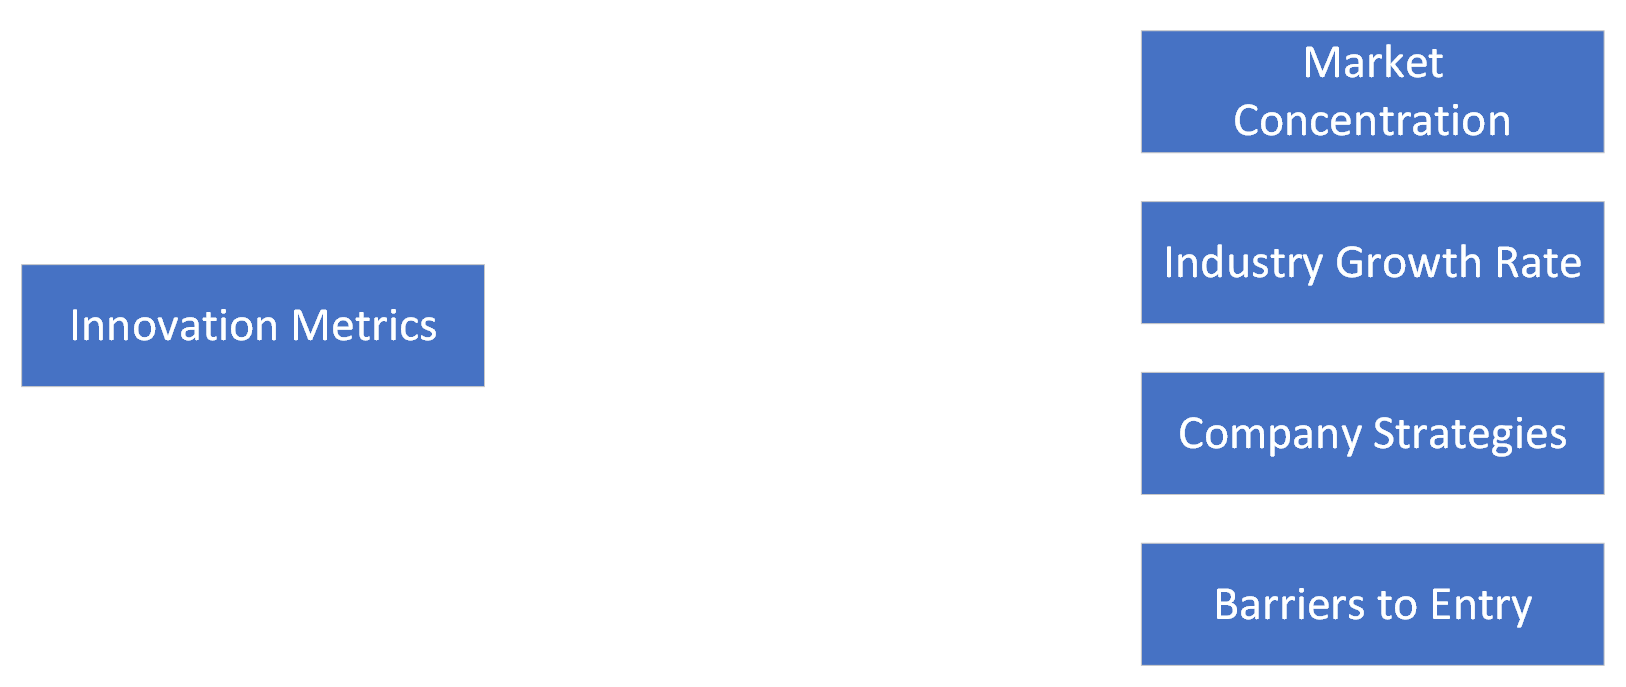
Mergers and Consumer Prices: The Directed Acyclic Graph (DAG) for Mergers and Consumer Prices suggests a direct causal effect of mergers on consumer prices. However, it's critical to consider industry characteristics, macroeconomic indicators, and other industry shocks as potential confounders that could influence this relationship. For instance, if a merger occurs concurrently with a significant technological advancement in the industry (an industry shock), consumer prices might drop due to efficiency gains rather than the merger itself. Market Concentration and Innovation: The DAG for Market Concentration and Innovation posits that an increase in market concentration could either hinder or foster innovation, depending on various factors like company strategies and barriers to entry. A highly concentrated market might discourage innovation due to reduced competition, yet it could also lead to more innovation if the concentrated entities invest more heavily in R&D. Consumer Price Index for IT Hardware and Services: The downward trend in the CPI for IT Hardware and Services, as seen in the FRED graph, can reflect increased market efficiency and competitive pricing in the tech industry. This trend implies that consumers are enjoying lower prices over time, potentially due to technological advancements that reduce production costs. Long-Term Price Trends for Electronic Goods and Services: The contrasting trends in hardware vs. services, where hardware sees price deflation while services like cable and satellite television increase, suggest that different segments of the tech industry are subject to distinct market forces. This differentiation is crucial to understanding the broader impact of mergers and market concentration on the tech industry. Total Deal Value of Tech M&A: The rise in M&A activity, particularly the notable peaks, might indicate periods of strategic consolidation in the tech industry, which could have implications for both consumer prices and innovation. The graph could be used to cross-reference with periods of significant technological breakthroughs or regulatory changes to understand their impact on industry dynamics. CPI - IT Hardware and Services Seasonality: Seasonal trends in CPI suggest that consumer prices for technology-related goods and services fluctuate throughout the year. This seasonality could be influenced by product release cycles, holiday discounting, or other market events that should be factored into the analysis of mergers and innovation. US Consumer Technology Spending: The fluctuating consumer spending on technology could be indicative of market saturation, shifts in consumer preferences, or the economic climate. The recent decline could prompt tech companies to pursue mergers or increase innovation to capture market share and revitalize spending.
3. Analysis:
For our analysis we compared the number of acquisitions made since 1991 for major tech companies and computer software merger and acquisition deal value in billions USD from 2012 to 2020.
3.1. Correlation Coefficient:
The sample estimate of the correlation coefficient between the number of acquisitions made since 1991 for major tech companies and computer software merger and acquisition deal value in billions USD from 2012 to 2020 is approximately 0.0998. This measures the strength and direction of a linear relationship between the two variables and suggests that there is a very weak positive linear relationship between the two variables.
3.2. Test Statistic:
The test statistic is 2.5167223 which suggests a statistically significant result.
3.3. P-Value:
The P-Value is 0.035992057. The P-Value suggests that the observed data provides enough evidence to reject the null hypothesis.
3.4. Alternative Hypothesis:
Because there is a significant linear relationship between number of acquisitions for major tech companies and computer software merger and acquisition deal values, the alternative hypothesis states that the true correlation is not equal to zero.
3.5. Confidence Interval:
The confidence interval of 95 gives us a range of which we can be 95% confident of the true correlation between number of acquisitions for major tech companies and computer software merger and acquisition deal values.
5. Conclusion:
In conclusion, our empirical project provides information on the intricate landscape connecting mergers, consumer prices, market concentration, and innovation within the technology sector. The findings detail a statistically significant positive correlation.
Confidence intervals (CIs) and p-values are statistical measures that can provide insights into the relationship between mergers, consumer prices, market concentration, and innovation within the technology sector.
A confidence interval gives a range of values, derived from sample statistics, that is likely to contain the value of an unknown population parameter. For example, when examining the effect of mergers on consumer prices in the tech sector, a 95% CI for the average price change due to mergers indicates that, if we were to take many random samples from the population and calculate the confidence interval for each sample, we would expect 95% of those intervals to contain the true average price change due to mergers. If the CI does not cross zero, it suggests that there is a statistically significant effect of mergers on prices.
On the other hand, the p-value is a measure of the strength of evidence against the null hypothesis, which typically posits that there is no effect or no relationship. A low p-value (typically less than 0.05) indicates that the observed effect (such as a change in consumer prices or market concentration due to mergers) is unlikely to have occurred under the null hypothesis of no effect. In other words, a low p-value suggests that the observed correlation is not due to random chance.
Together, CIs and p-values can provide a more complete picture of the statistical evidence. For instance, in studying the impact of mergers on market concentration in the tech industry, a narrow confidence interval and a low p-value for the measure of market concentration (like the Herfindahl-Hirschman Index) would suggest a strong and precise estimate of the effect of mergers. Similarly, in examining the correlation between mergers and innovation, if the p-value associated with the number of patents filed after mergers is low and the confidence interval is above zero, it would indicate a significant positive effect of mergers on innovation.
By using these statistical tools, researchers can assess the validity of claims about the impact of mergers in the tech sector on consumer prices, market concentration, and innovation. It is crucial, however, to interpret CIs and p-values correctly, considering the context and the methodology of the study, to make informed decisions and policies.
As we put together this diverse information, it becomes evident that the nexus between mergers, consumer prices, market concentration, and innovation is very dynamic. The downward trend in technology costs, combined with the ups and downs of M&A activities and varying pricing, displays an industry that is constantly changing. The Consumer Price Index (CPI) trends showcase the deflationary nature of technology hardware costs mixed with potential inflation in service-oriented segments. This mirrors the different effects of mergers on consumer prices, emphasizing the need for a greater understanding that goes beyond mere cost reductions. The path of mergers and acquisitions (M&A) in the technology sector highlights the fluctuation of the sector, with consolidation and investment posing as key devices for growth and competitiveness. This aligns with our introductory exploration into how major mergers can shape consumer welfare, market efficiency, and policy implications. Introducing seasonality in our project shows the cyclical nature of tech pricing. The consistent decline in prices throughout the year, caused by factors such as new product releases and seasonal sales, details the importance of considering time variations in our analysis. This dynamic aspect shows that adaptation to seasonal patterns can significantly influence consumer decisions and overall industry performance. Finally, the U.S. consumer technology spending highlights the influence of external factors on consumer behavior and business strategies, reiterating the importance of considering broader economic conditions and market trends in our exploration. Our journey through this data illuminates the ongoing debate and controversies surrounding the tech sector, particularly in understanding the relationship between market concentration and innovation. Our research highlights the ever-changing reality of the technology sector.