Model fitting and evaluation with JAX
The data app uses the Countries of the world.csv dataset, which includes key country data e.g. population, area, GDP, literacy rates, infant mortality, migration etc., these insights help to understand the demographic, economic, and social profiles of countries worldwide.

Data filtering and preparation
The FilterData class preprocesses data by filtering, cleaning, and splitting it into training and testing sets. It reshapes the features and target variable into the right format, and handles group-based splits if needed. The to_jax method converts data for JAX, while extract_vars processes both categorical and numerical variables into JAX-compatible formats for modeling.
Loading and preprocessing the dataset
The CountriesData class loads and preprocesses the countries_of_the_world.csv dataset. It encodes the region column with numeric values, cleans the data by removing extra spaces, replacing commas, and handling invalid entries. The cleaned data is stored as self.countries, and the region mapping is saved as self.region_map. The correlations method calculates correlations between the chosen column (e.g., GDP) and other numeric columns in the dataset.
Correlation analysis
In this step, the correlations() method from the CountriesData instance (CD) was used to get a correlation matrix of the dataset’s numeric columns. Next, the data by Region_Encode was grouped, calculating the average GDP and literacy rates for each region. The resulting matrix reveals:
Violin plot: Shows the distribution of GDP per capita by region, capturing both spread and central tendency.
Scatter plot: Displays the link between phone usage and GDP per capita, with each country color-coded by region.
3D scatter plot: Illustrates the relationships among phones per 1000, GDP per capita, and literacy rates across countries.
The FilterData class uses JAX to convert data into efficient, high-performance arrays. It processes categorical and numerical variables by encoding them and converting each to a JAX-compatible format, making the data ready for optimized computations, like those needed in machine learning tasks. This JAX integration enables faster processing and compatibility with GPUs or TPUs, ideal for high-computation workflows.
Clustering
This part is about grouping data in a way that highlights similarities between different countries based on certain characteristics. The process used here is called clustering. Clustering is a way to automatically group data points so that items in the same group (or cluster) are more similar to each other than to items in other groups. In this case the collection of countries has a range of characteristics (like economic data, population metrics, etc.), and to identify groups of countries that are most alike based on these features, the clustering algorithms are used (KMeans). The KMeans format groups based on patterns and similarities in the data.
The code below group countries into clusters based on their similarities:
After setting up the initial clusters, the code calculates a silhouette score to see how well-defined the clusters are, then tests various cluster numbers to find the best grouping by recalculating the silhouette score each time.
A silhouette score ranges from -1 to 1, with values near 1 indicating well-separated clusters, scores around 0 meaning clusters may overlap, and negative values (like -0.256) showing poor clustering. This negative score suggests the current clusters aren’t well-defined, so adjusting the number of clusters, trying a different method, or refining preprocessing could help. However, this notebook is focused on demonstrating JAX, so this will not be addressed further.
In the graph below, the progression of the silhouette score across different layers can be seen.
Probabilistic inference
The Probabilistic_Inference class helps make smarter predictions by updating model parameters based on new data, using a process called Bayesian inference. Rather than producing a single estimate, Bayesian inference combines prior knowledge with observed data to calculate a range of possible values for each parameter. This class applies advanced sampling methods like NUTS and HMC to approximate these distributions, while JAX powers the calculations on specialized hardware, ensuring the sampling is fast and consistent.
Plots:
Model fitting, evaluation, and visualization
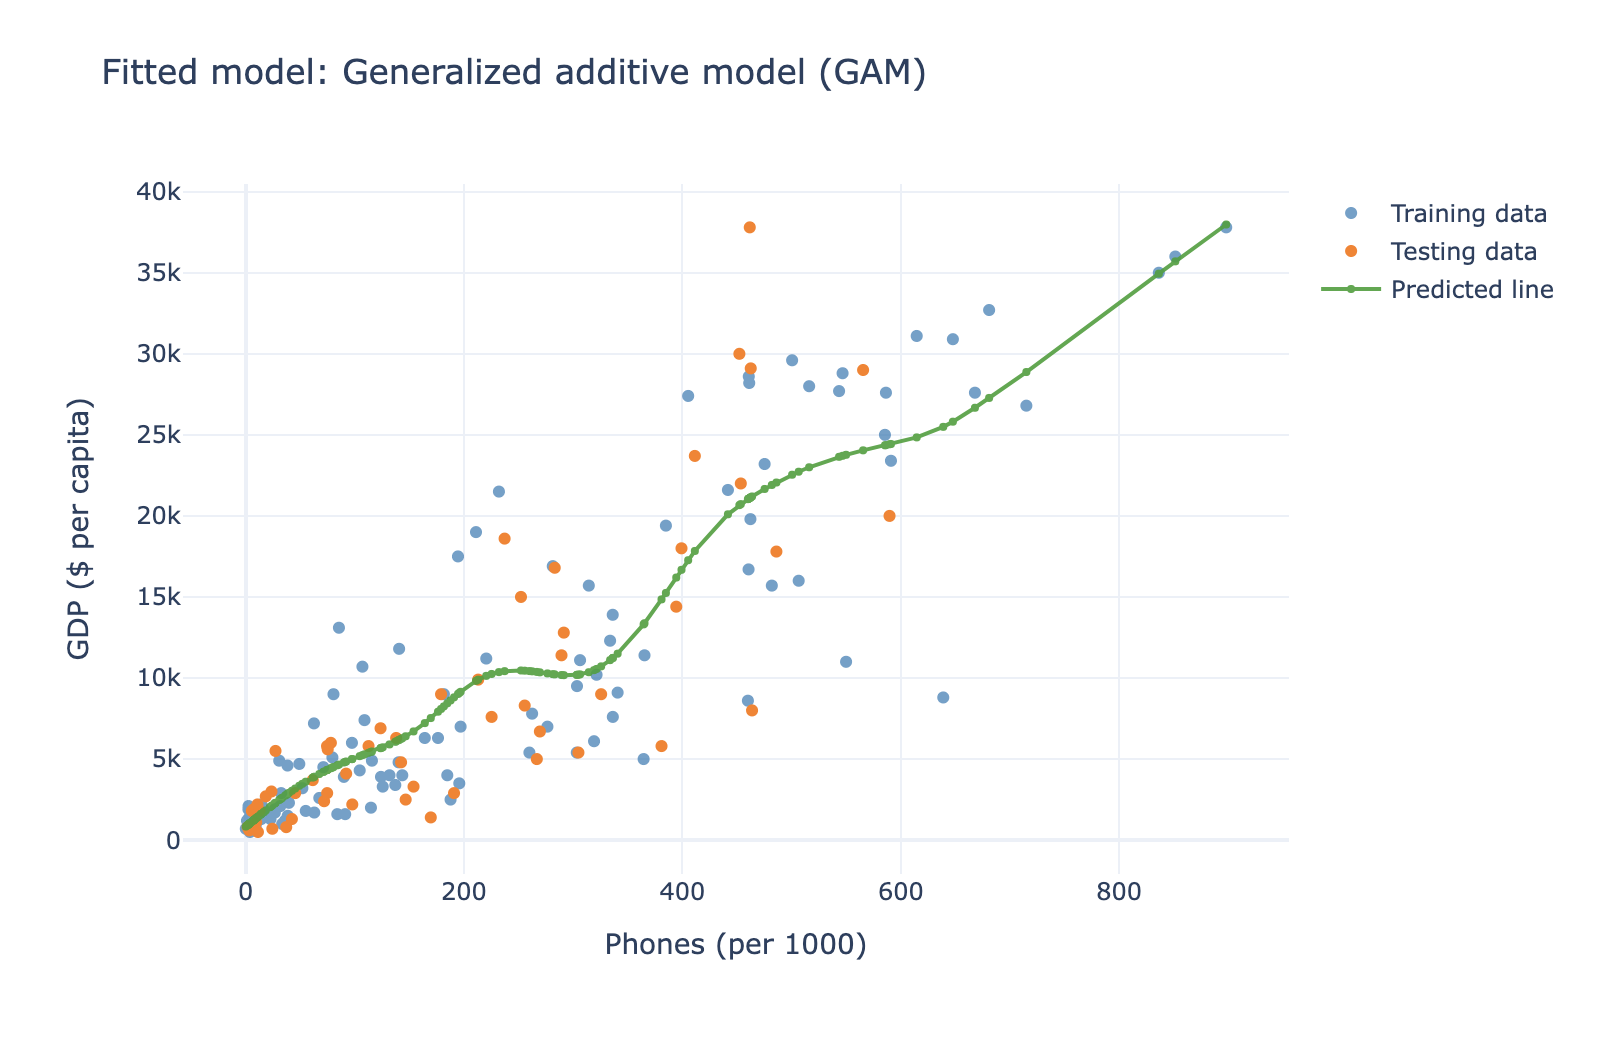
This part of the data app creates a FrequentistModels class that fits and evaluates machine learning models like linear regression or generalized additive models, then visualizes the results.
Visuals:
The plot visually shows how well the model fits the training and testing data. The prediction line will help assess whether the model captures the general trend of the data.
R² score:
Additionally, the R² score is printed, which tells how well the model explains the variance in the data. An R² score of 1 indicates a perfect fit, while a score closer to 0 indicates a poor fit. R² score in this output is 0.85, that means that 85% of the variance in the test data is explained by the model, which is a good fit.
The code fits a machine learning model, evaluates its performance (R² score), and visualizes both the training/testing data and the model's predictions on a plot. The output helps assess both the fit of the model (via R² score) and visually how well the model's predictions align with the data.
Conclusion
This JAX-based approach offers fast, flexible model fitting, evaluation, and visualization, making it ideal for machine learning workflows. By incorporating uncertainty through stochastic processes, it enhances flexibility while maintaining efficiency. However, probabilistic models may require expertise, which can be eased by using uninformative priors, bridging to frequentist methods when necessary. If this topic caught someone's interest, here is more information and a more developed project by Zach Wolpe on his GitHub.