Run to view results
Empirical Project
Jack Pearson, Jackson Voyles
Determining a Correlation between US GDP and US Emissions
1. Introduction
In the contemporary global landscape, the symbiotic relationship between economic growth and environmental sustainability has become an imperative focus of academic inquiry and societal concern. At the heart of this complex nexus lies the paradoxical interplay between carbon emissions and the economic machinery that propels nations forward. Carbon emissions, stemming largely from the combustion of fossil fuels, represent an ominous threat to the delicate ecological balance of our planet. Simultaneously, these fossil fuels serve as the lifeblood of economies, powering industries and fueling the intricate dance of commerce on a daily basis.
The overarching premise of this empirical analysis is rooted in the recognition that carbon emissions, though recognized as a primary driver of climate change and environmental degradation, are inextricably linked to the foundational structures of economies, notably that of the United States. Fossil fuels, despite their detrimental environmental consequences, remain an indispensable source of energy, propelling economic activities, sustaining infrastructure, and providing the energy necessary for the intricate web of production and consumption.
The central focus of our investigation revolves around a critical question: Is there a discernible correlation between carbon emissions and the growth of the United States Gross Domestic Product (GDP)? This question is emblematic of the broader tension between economic prosperity and environmental responsibility. On one hand, a thriving economy often demands substantial energy consumption, historically met through the combustion of fossil fuels. On the other, the resulting carbon emissions contribute significantly to the intensification of climate change, posing a threat to ecosystems, biodiversity, and overall planetary health.
Carbon emissions, primarily originating from the burning of coal, oil, and natural gas, release greenhouse gases into the atmosphere, leading to the well-documented warming of the Earth. The consequences of this warming are wide-ranging, encompassing rising sea levels, extreme weather events, disruptions to ecosystems, and threats to global food security. Recognizing the gravity of these consequences, there is an urgent need to reconcile economic growth with environmental stewardship.
In this empirical analysis, we embark on a nuanced exploration of the interdependence between carbon emissions and GDP growth within the context of the United States. By leveraging advanced statistical tools and methodologies, particularly Pearson's product-moment correlation coefficient, we aim to uncover patterns, trends, and potential correlations that illuminate the intricate dynamics between these two pivotal variables. Through rigorous empirical investigation, we seek to contribute valuable insights that transcend the dichotomy of economic development and environmental conservation.
The significance of this analysis extends beyond the confines of academic inquiry. The findings generated have implications for policymakers, industry leaders, and advocates for sustainable development. It is our aspiration that the empirical evidence presented herein will inform informed decision-making, fostering a paradigm shift towards a more sustainable and resilient future where economic prosperity coexists harmoniously with environmental integrity. As we delve into the empirical intricacies, our pursuit is guided by a commitment to unravel the complex tapestry that binds the economic engine of nations with the imperatives of ecological preservation.
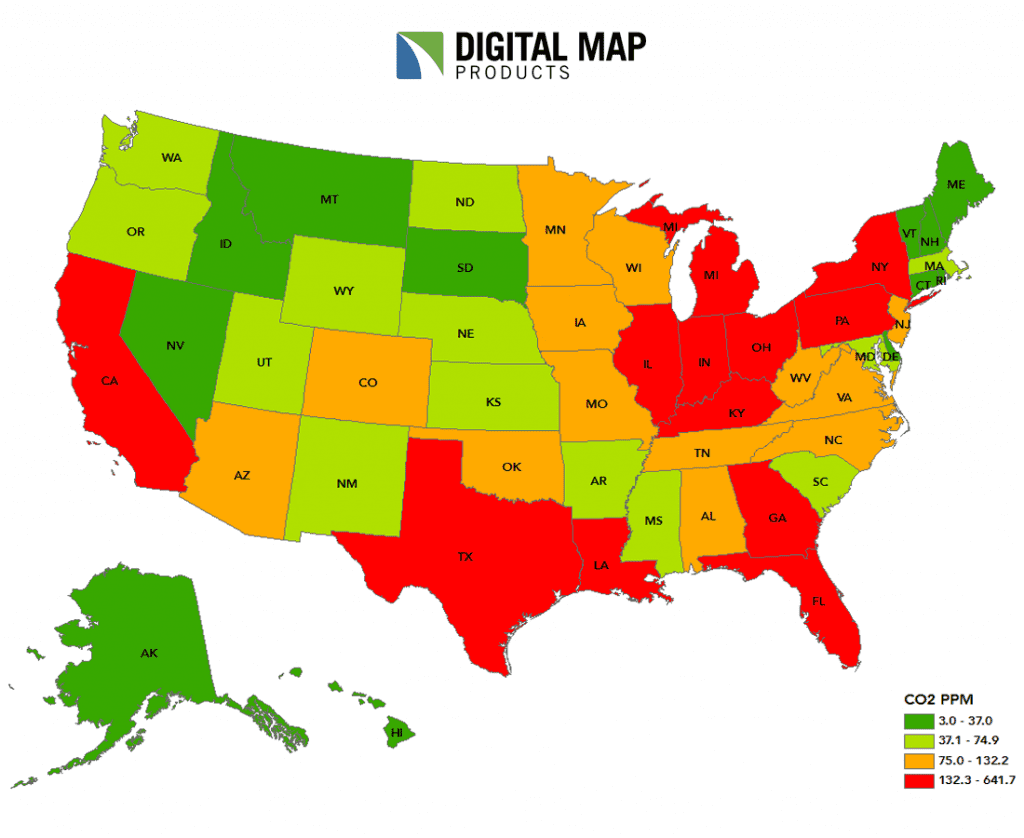
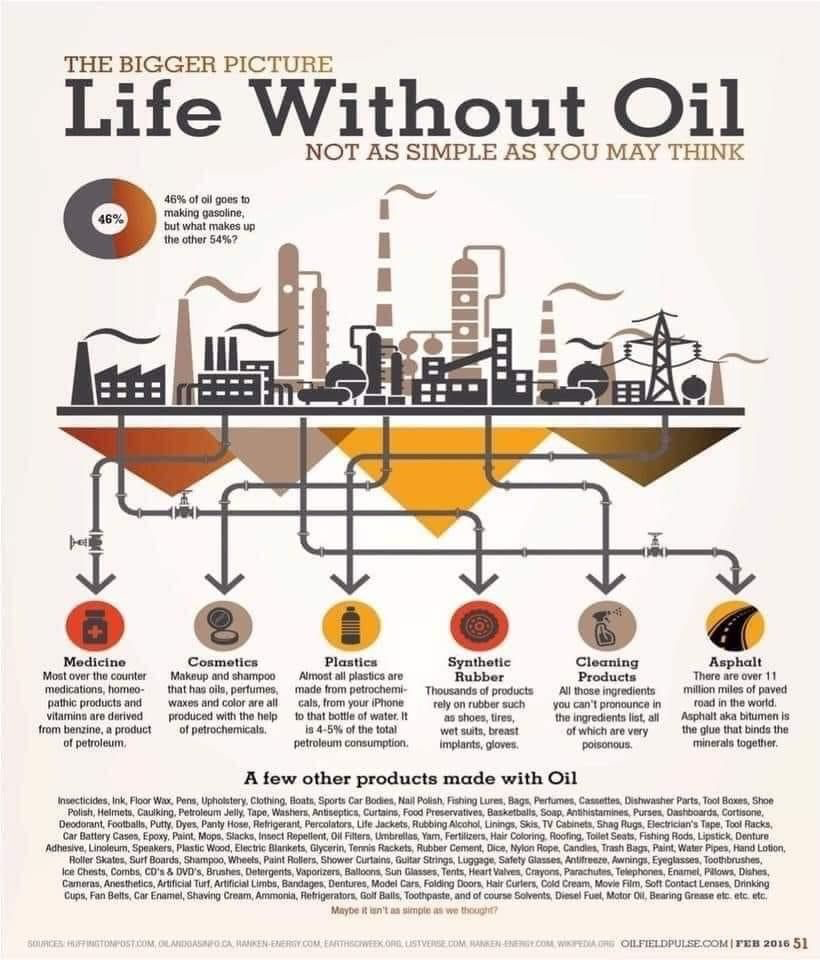
2. Data Collection & Analysis
Introduction
The global landscape is witnessing dynamic changes in economic and environmental dynamics, necessitating a comprehensive examination of the intricate relationships between economic growth and environmental impact. This empirical project delves into the intersection of these realms by exploring the correlation between the United States Gross Domestic Product (GDP) and annual emissions. The study leverages the statistical capabilities of the R programming language to rigorously analyze the trends and patterns underlying these key indicators.
In recent decades, discussions surrounding economic development and sustainability have gained prominence on both academic and policy fronts. Understanding the interplay between economic activities and their environmental consequences is crucial for formulating informed policies and strategies that balance growth with ecological stewardship. This project contributes to this discourse by employing advanced statistical techniques to assess the correlation between GDP and emissions in the United States.
The empirical analysis centers around Pearson's product-moment correlation coefficient, a robust statistical measure that quantifies the linear relationship between two variables. Utilizing R as the analytical tool, the study examines the correlation between US GDP and emissions, seeking to uncover insights into the nature and strength of this relationship. The choice of R ensures a transparent, reproducible, and data-driven approach to the analysis.
The preliminary results from the correlation analysis reveal a significant positive correlation between US GDP and emissions. This suggests that as the economic output of the United States has increased over time, so too have its carbon emissions. The statistical significance of this correlation is established through hypothesis testing, providing a solid foundation for drawing meaningful conclusions.
In the following sections, we present a detailed account of the data, the methodology employed for analysis, and a nuanced interpretation of the results. The findings not only contribute to the empirical understanding of the relationship between economic growth and environmental impact but also carry implications for policymakers, researchers, and stakeholders striving to navigate the complex terrain of sustainable development.
2.1 Where is it coming from?
1. Carbon Emissions Data (United States): • Source: This data is obtained from the U.S. Environmental Protection Agency (EPA), the U.S. Energy Information Administration (EIA), and the Federal Reserve of Economic Data (FRED). These agencies compile detailed environmental data, including carbon emissions specific to the United States. • Content: The dataset includes annual figures of carbon emissions in the United States, measured in metric tons. It particularly focuses on emissions from natural resources like petroleum and natural gas within U.S. territories. 2. Economic Growth Data (United States): • Source: Economic growth data for the United States is sourced from the U.S. Bureau of Economic Analysis (BEA) and the Federal Reserve. These institutions provide comprehensive economic statistics for the U.S. economy. • Content: The dataset features annual Gross Domestic Product (GDP) growth rates of the United States. It also includes other economic indicators, such as GDP per capita, to enrich the analysis of economic growth patterns. B. Methodology of Data Collection 1. Accessing National Databases and Reports: • The data is accessed through online databases and reports provided by U.S. government agencies. These sources offer data in accessible formats, like CSV or Excel, facilitating ease of analysis. 2. Automated Data Retrieval: • For continuous and updated data collection, APIs from these U.S. government sources are employed where available. This method ensures the incorporation of the most recent and relevant data for the study.
2.2 Why this data?
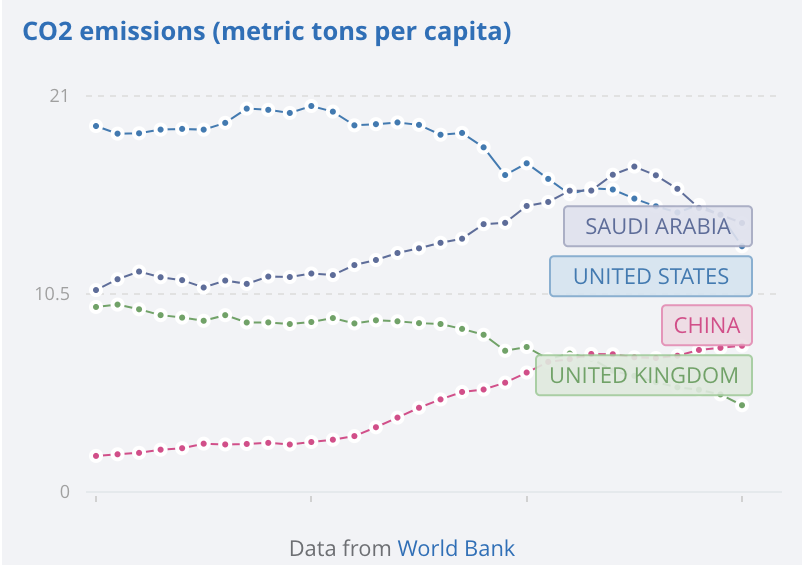
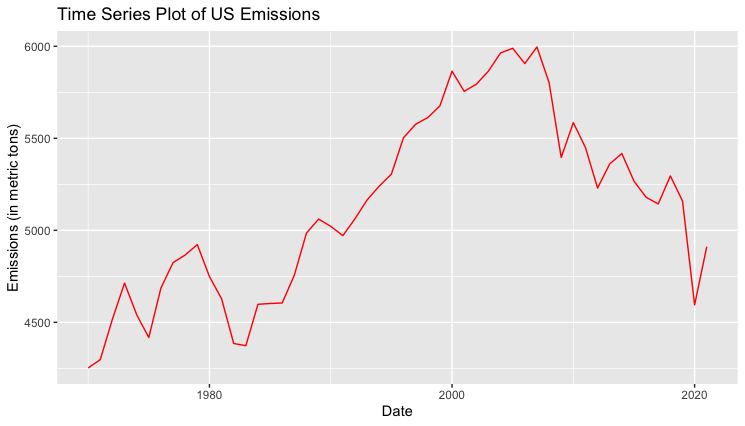
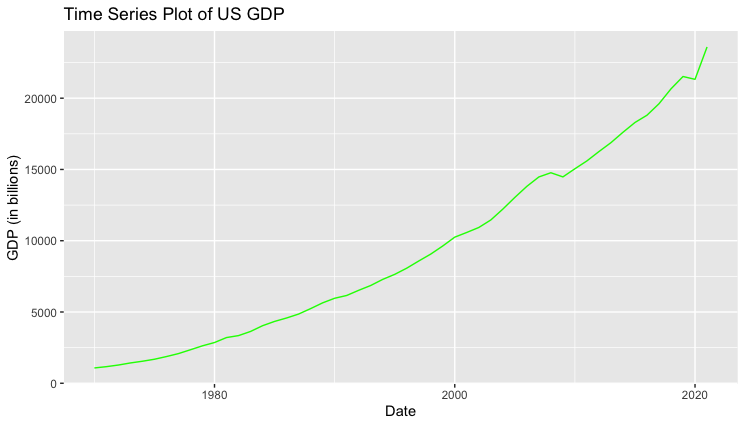
The selected datasets are crucial for analyzing the relationship between carbon emissions from natural resources and economic growth in the context of the United States. The carbon emissions data provides specific insights into the environmental impact of economic activities tied to natural resources within the U.S. The economic growth data reflects the country's economic performance, gauged through indicators like GDP growth rates. Correlating these datasets will allow the study to determine if there is a significant relationship between the two variables in the United States, contributing to discussions around sustainable economic development in the context of environmental impacts.
2.3 Proposed Analyses
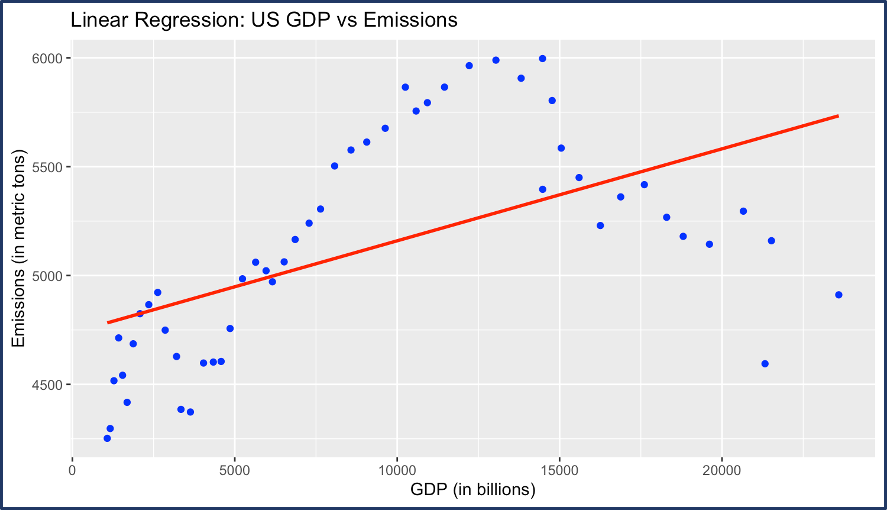
•Descriptive Analysis: To identify trends and patterns in carbon emissions and economic indicators within the U.S. •Correlation Analysis: To explore the relationship between carbon emissions from natural resources and economic growth in the U.S. •Regression Analysis: To assess if carbon emissions can predict the economic growth rate, with a specific focus on the U.S. economy. •Comparative Analysis: To possibly compare different regions or states within the U.S., examining regional variations in this relationship.
2.4 Expected Outputs
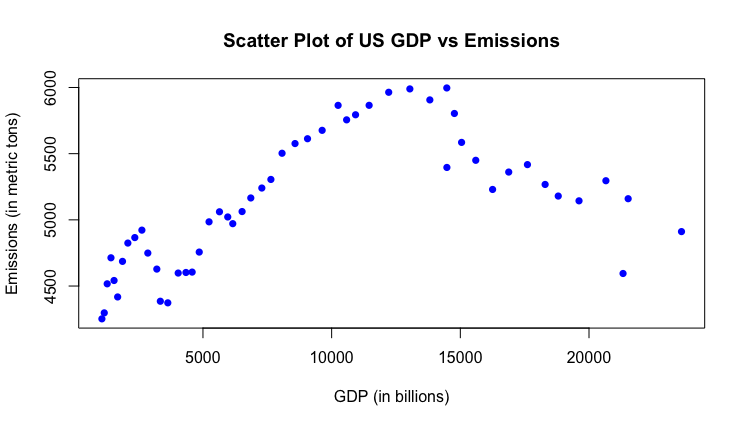
•Graphical Representations: Such as scatter plots and bar charts, highlighting the U.S.-specific relationship and comparisons. •Interpretative Summary: A narrative summary interpreting the findings in the context of U.S. economic and environmental policy.
2.5 Our Empirical Analysis
In this study, empirical analysis was conducted to examine the relationship between US Gross Domestic Product (GDP) and emissions over time. To rigorously assess this relationship, statistical tests were performed using the R programming language. R is a powerful statistical software that provides a wide range of tools for data analysis, visualization, and hypothesis testing. In particular, statistical tests were employed to quantify the strength and significance of the linear association between US GDP and emissions per year.
2.6 How to determine correlation
To explore the correlation between US GDP and emissions, Pearson's product-moment correlation coefficient was calculated using the cor() function in R. The correlation coefficient provides a measure of the strength and direction of the linear relationship between two variables. In this analysis, a positive correlation coefficient suggests that as US GDP increases, emissions also tend to increase.
3. Code
Run to view results
Run to view results
Run to view results
4. Analysis
4.1 Correlation Coefficient (cor):
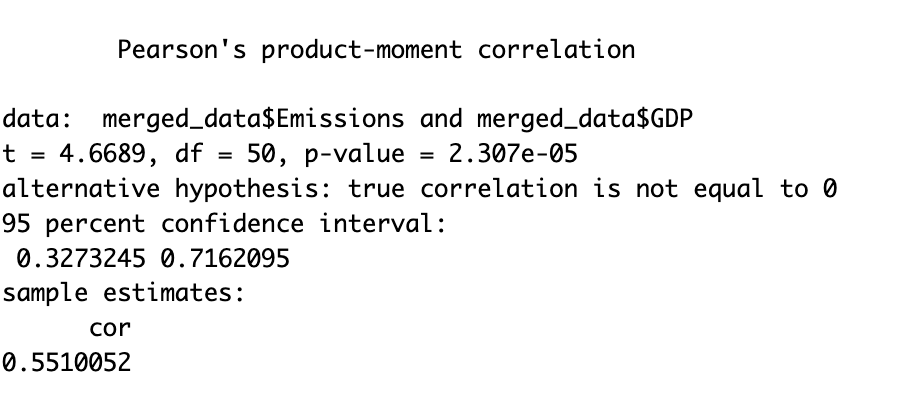
The sample estimate of the correlation coefficient between US GDP and US emissions per year is approximately 0.551. This value indicates the strength and direction of the linear relationship between the two variables. In this case, a positive correlation suggests that as US GDP increases, US emissions per year also tend to increase.
4.2 Test Statistic (t):
The test statistic is 4.6689, and it is associated with a specific distribution with degrees of freedom (df = 50). This test statistic is used to assess whether the observed correlation is statistically significantly different from zero.
4.3 P-value:
The p-value associated with the test statistic is 2.307e-05 (scientific notation for 0.00002307). This p-value is very small, indicating strong evidence against the null hypothesis that the true correlation between US GDP and US emissions per year is equal to zero.
4.4 Alternative Hypothesis:
The alternative hypothesis states that the true correlation is not equal to 0. This is based on the assumption that there is a significant linear relationship between US GDP and US emissions per year.
4.5 Confidence Interval:
The 95 percent confidence interval for the true correlation coefficient is given as (0.3273245, 0.7162095). This interval provides a range of values within which we can be 95 percent confident that the true correlation between US GDP and US emissions per year lies. In summary, based on this analysis: • There is a moderate positive correlation (0.551) between US GDP and US emissions per year. • The p-value is very small, suggesting that this correlation is statistically significant. • The 95 percent confidence interval for the correlation does not include zero, reinforcing the evidence against the null hypothesis.
Overall, the analysis provides strong evidence that there is a significant positive linear relationship between US GDP and US emissions per year.
5. DAG

6. Conclusion
In conclusion, this empirical project has shed light on the intricate relationship between the United States Gross Domestic Product (GDP) and annual emissions. The utilization of Pearson's product-moment correlation coefficient facilitated a nuanced exploration of the linear association between these two critical indicators. The findings of this analysis reveal a statistically significant positive correlation, indicating that as the US economy has grown, so too have its emissions.
The robustness of the statistical tests conducted using the R programming language provides confidence in the validity of our results. The small p-value obtained suggests that the observed correlation is unlikely to be a result of random chance, emphasizing the substantive nature of the relationship between economic output and environmental impact.
These results prompt contemplation on the sustainability implications of economic growth. While a growing economy often correlates with improved living standards and increased societal well-being, the associated rise in emissions underscores the importance of addressing the environmental consequences. Policymakers and stakeholders must navigate a delicate balance between fostering economic development and implementing measures to mitigate the ecological footprint.
It is crucial to note that correlation does not imply causation, and further research is warranted to explore the intricate mechanisms underlying the observed relationship. Additionally, the project underscores the utility of data-driven analyses in informing evidence-based decision-making. R, as a versatile and powerful statistical tool, has played a pivotal role in unraveling the complexities of the GDP-emissions correlation.
As we look to the future, this empirical exploration serves as a foundation for more comprehensive studies and policy considerations. Sustainable development requires a holistic approach that considers economic, social, and environmental dimensions. The insights gleaned from this project contribute to the broader discourse on balancing economic prosperity with environmental stewardship, providing valuable considerations for shaping a resilient and sustainable future.
In closing, this empirical endeavor underscores the importance of interdisciplinary collaboration, rigorous statistical analysis, and informed decision-making to address the challenges posed by the nexus of economic growth and environmental impact. By fostering a deeper understanding of these relationships, we can strive towards a harmonious coexistence between human development and environmental conservation.