Artificial intelligence (AI) has transcended its role as a niche technological innovation to become a central driver of economic transformation worldwide. This study investigates how AI adoption influences GDP growth and labor productivity across developed and developing nations, probing the mechanisms through which automation, data analytics, and machine-learning–driven efficiencies translate into macroeconomic gains. By contrasting high-income economies—such as the United States, Germany, and Japan—with emerging markets like India, Brazil, and Nigeria, we seek to uncover both the opportunities and constraints that shape AI’s economic impact in differing institutional and infrastructural contexts. Our analysis not only quantifies the productivity dividends associated with AI deployment but also examines how factors like human capital, policy frameworks, and digital infrastructure mediate those outcomes, providing insights for policymakers and business leaders aiming to foster inclusive, AI-driven growth.
Data Sources and Methodology
To construct a comprehensive empirical dataset, we drew on a diverse array of reputable sources. AI adoption rates for 2022 were sourced from the IBM Global AI Adoption Index, while 2024 figures and forecasts come from McKinsey’s “State of AI 2024” report. GDP growth and labor productivity metrics were obtained from the International Monetary Fund’s World Economic Outlook and the World Bank’s World Development Indicators. Supplementary qualitative context on digital infrastructure and policy initiatives was gathered from the IMF blogs, the Center for Global Development, and the Barclays Investment Bank AI productivity report. Where necessary, we supplemented these with UN population data and national statistical releases to ensure coverage across all target countries, enabling robust cross-country comparisons.
Run to view results
These graphs compare GDP growth trends between high- and low-GDP countries from 2000 to 2025, contextualized by major AI milestones. The top graph shows that developed nations like the U.S., Germany, and Japan maintain relatively stable, moderate growth, with limited fluctuation around AI breakthroughs like Deep Learning (2012), AlphaGo (2016), and ChatGPT (2022). Meanwhile, the bottom graph highlights the more volatile but potentially high-growth trajectories of developing nations like Nigeria and Kenya. These countries experience sharper spikes and dips, suggesting greater sensitivity to external changes but also untapped potential. As AI technology becomes more accessible, countries like Nigeria and Kenya could capitalize on it to accelerate long-term growth, especially if paired with improvements in internet infrastructure and digital policy.
Run to view results
This graph highlights a key foundation for long-term AI-driven growth: internet access. It shows a strong relationship between GDP per capita and digital connectivity, with developed countries like the U.S. and Germany already having the infrastructure to fully leverage AI across sectors. These nations are positioned for steady gains in labor productivity as AI automates tasks, enhances efficiency, and optimizes workflows. However, the most transformative potential lies with developing countries like Nigeria and Kenya. Although they currently show lower GDP and limited internet access, their position on the curve suggests that improvements in connectivity could catalyze widespread AI adoption. This, in turn, could dramatically boost labor productivity by addressing skill gaps, streamlining industries, and creating entirely new economic opportunities. Over the long run, as these nations embrace digital tools and AI systems, they may not just catch up—they could leap ahead in terms of GDP growth and productivity, fundamentally reshaping the global economic landscape.
Run to view results
This graph illustrates the relationship between internet access and AI adoption across six countries, highlighting how infrastructure influences technological advancement. Countries like China and the U.S. demonstrate high AI adoption, supported by broad internet access. Interestingly, China outpaces others, suggesting strong national investment and strategic focus on AI. Meanwhile, India shows solid adoption despite moderate infrastructure, hinting at rapid tech sector growth. In contrast, Nigeria and Kenya lag in both metrics, revealing the infrastructural gap that hinders AI integration. The trendline suggests that increasing internet access generally leads to greater AI adoption, and for developing nations, this could unlock exponential economic growth as access expands and technology scales.
Run to view results
Run to view results
The 2022 bubble chart lays out the baseline relationship between corporate AI adoption and GDP growth for ten leading economies—drawing on IBM’s 2022 AI Index, IMF growth forecasts, and UN population data. India already topped the list at 59 % AI uptake with ≈ 7 % GDP growth, while mature markets like the United Kingdom (37 % AI, 4.3 % growth) and the United States (33 % AI, 2.5 % growth) saw more modest gains. It’s important to note that data availability varied by country—some smaller markets or those without consistent reporting aren’t shown—and we focused on the ten with complete 2022 figures. The gentle positive slope of the 2022 trendline suggests that early adopters did capture productivity lift, but the full economic payoff was still emerging.
By 2024, McKinsey’s “State of AI 2024” report offers reliable adoption rates for only four major markets—India (~78 %), China (~72 %), the U.S. (~55 %), and the U.K. (~61 %)—so our 2024 bubble chart highlights those where comparable metrics exist. Forecast GDP growth softens in the U.S. (≈ 2.1 %) and the U.K. (≈ 0.4 %) even as India and China maintain 6–5 % expansions, steepening the observed trendline. The absence of consistent 2024 figures for other countries underlines ongoing reporting gaps in global AI metrics. Together, these visuals underscore your project’s core insight: as AI spreads beyond pilot stages, its impact on output strengthens, provided firms and policymakers invest in digital infrastructure, workforce skills, and governance frameworks to turn raw adoption into sustainable economic growth.
Run to view results
The plotted series begin only once each platform reported verifiable user figures, which avoids implying zero adoption before launch. For example, ChatGPT’s curve starts at ~1 M users five days after its November 2022 public beta and then accelerates to 100 M MAU by January 2023, 300 M WAU by December 2024, and 400 M WAU by February 2025—an average annual growth rate exceeding 150 % from 2023 to 2024 . Although Google introduced the Gemini model on December 6, 2023, no MAU data were released until October 2024 (42 M MAU), so its curve logically begins in 2024; it then surged to 350 M MAU by March 2025, implying an annualized increase of over 730 % in under six months . Anthropic Claude’s early traffic—from 4 M visitors in December 2023 to 18.8 M in November 2024—reflects steadier diffusion, while late entrants like DeepSeek (61.8 M WAU in February 2025) and Character.AI (28 M MAU in early 2025) demonstrate how niche features or community-driven growth can still rapidly attract tens of millions of users. Empirically, these divergent slopes underscore three key dynamics: (1) first-mover advantage, where early launchers like ChatGPT capture mindshare and network effects; (2) bundling and distribution, exemplified by Gemini’s spike after Android and Workspace integration; and (3) differentiated value propositions, as seen in specialized challengers carving out user segments. Together, the data reveal that timing, platform partnerships, and unique feature sets are just as critical as core AI capabilities in shaping real-world adoption trajectories
Run to view results
The chart contrasts three perspectives on worldwide AI uptake. The solid blue line shows that actual adoption climbed steadily from roughly 54 % in 2021 to about 64 % in 2024, adding 3–5 percentage points each year. From that 2024 baseline, McKinsey’s linear forecast (red dashed line) projects a more measured trajectory, nudging global adoption to ≈ 70 % by 2030—an average gain of just 1 pp per year that implies gradual saturation and persistent organizational frictions. By comparison, our exponential scenario (green dash‑dot line) assumes network effects, falling implementation costs, and competitive pressure will compound, pushing adoption past 90 % by 2030. The widening gap—over 20 pp by decade’s end—highlights how sensitive long‑run projections are to assumptions about diffusion dynamics: if the recent acceleration continues, McKinsey may be understating AI’s pervasive reach, whereas our curve emphasizes the strategic urgency for firms and policymakers to prepare for near‑universal deployment. (Underlying data: McKinsey Global Survey via Our World in Data for 2021‑24 actuals; authors’ own extrapolations for 2024‑30.)
So, depending on how quickly this newer generation of AI continues to spread, especially into developing countries, we could see huge differences in GDP growth and productivity. Faster adoption, as shown in the higher forecast, could mean bigger gains globally, while slower uptake might limit these benefits, particularly where infrastructure or skills gaps still exist.
Run to view results
Between 2022 and 2023, every market saw double-digit jumps in student AI use: China climbed from 50 % to 70 % (+20 pp), the UK surged from 25 % to 66 % (+41 pp), India rose from 15 % to 37 % (+22 pp), Germany grew from 30 % to 44 % (+14 pp), and the US moved from 20 % to 37 % (+17 pp). These disparities mirror how national strategies—from China’s top-down AI curriculum mandates to the UK’s fast-growing ed-tech partnerships—accelerate classroom integration, while more decentralized systems in Germany and the US produce steadier uptake. If those 2022–23 trends continue, we’d expect most of these countries to surpass 80 % student adoption by 2025: China could approach near-universal use (~90 %), the UK and India might hit 75–85 %, and Germany and the US should exceed 60–70 %. That future growth underscores the urgent need for teacher training, ethical guidelines, and infrastructure investments to ensure AI truly enhances learning rather than simply automating it.
Run to view results
Run to view results
This graph compares each country’s AI readiness score—which measures how prepared they are to adopt AI technologies—with their unemployment rate in 2023. What we see is a slight negative correlation: as countries become more AI-ready, unemployment tends to be a bit lower. But the relationship is weak, as shown by the flat red trend-line and low correlation value (R = -0.11).
For example, developed countries like the U.S., Germany, and Japan have high AI readiness scores and low unemployment rates, which suggests that being prepared for AI adoption may help support labor markets. However, France stands out with high unemployment despite solid AI readiness, showing that other factors—like labor policies or economic conditions—also play a big role.
For developing countries like India and China, their lower AI readiness scores and higher unemployment rates suggest they’re still building the infrastructure and skills needed to fully benefit from AI. This graph supports the idea that AI readiness can influence labor outcomes, but the impact varies between countries depending on broader economic contexts.
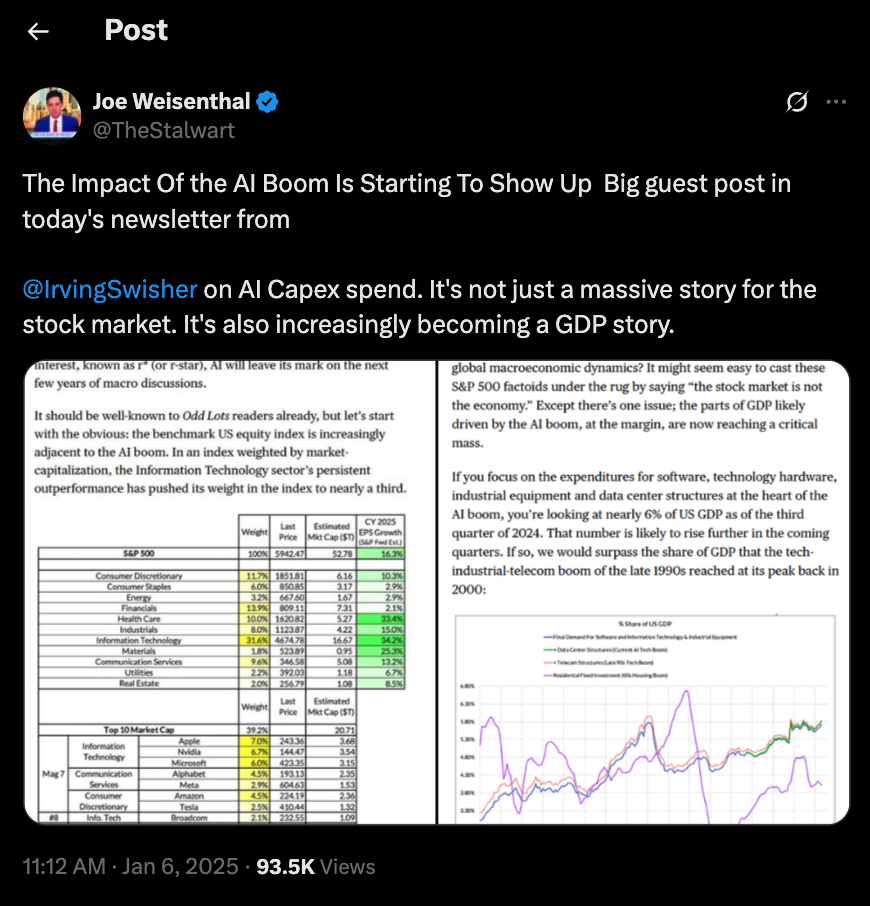
Joe Weisenthal is the executive editor of news at Bloomberg and co-host of the Odd Lots podcast, where he interviews top economists, policymakers, and market leaders. With over a decade of experience covering global markets, monetary policy, and financial trends, his insights are trusted by industry professionals worldwide. Backed by Bloomberg’s rigorous reporting standards, Weisenthal consistently delivers sharp, data-driven analysis, making him one of the most respected voices in financial journalism today.
Run to view results
This table shows how different sectors in the S&P 500 are weighted and their projected earnings growth for 2025. Information Technology, which heavily drives AI development, makes up the largest share at 30.5% with a strong 33% growth forecast. Sectors like Health Care and Industrials, which are also adopting AI, show high growth too. This connects to our topic by showing that AI adoption boosts sector earnings, especially in tech-heavy industries, which in turn drives GDP growth and productivity, particularly in countries leading these sectors.
Run to view results
In the context of our project—assessing how AI adoption translates into GDP growth across developed and developing nations—the dominance of AI-centric firms atop the S&P 500 underscores the link between private investment in AI and national economic outcomes. Apple, NVIDIA, and Microsoft alone carry over 19 percent of the index weight, with Amazon and Alphabet pushing that combined tech share above 30 percent. These firms not only drive hardware and software innovation (e.g., GPUs for deep learning, cloud AI services, on-device machine learning) but also signal where venture capital and public markets channel R&D spending. In economies like the U.S., such concentration of market value in AI leaders fuels spillovers into productivity—firms adopt AI tools for automation, data analytics, and decision support—helping explain why our bubble charts showed advanced economies’ high adoption rates translating into measurable growth .
Conversely, the sector-weight breakdown reveals that only mature markets with deep capital pools and robust digital infrastructure can sustain an IT weighting north of 30 percent. Financials, Consumer Discretionary, and Communication Services make up the next largest slices, but sectors like Energy, Materials, and Utilities remain underrepresented in AI investment. In developing countries—where local stock markets are less tech-heavy—GDP gains from AI may lag simply because domestic firms lack both the scale and the capital to chase frontier AI projects. Bridging that gap will require policy interventions (incentives, data-governance frameworks), targeted upskilling programs, and partnerships with global AI champions to replicate the productivity dividends we observe when AI adoption and financial-market backing move in tandem.

Companies like Nvidia, with massive market caps and leadership in AI chip manufacturing, have a significant impact on both local and global economies. Locally, their expansion into regions like Houston brings high-tech jobs and economic diversification beyond traditional industries. Globally, firms like Nvidia drive AI adoption, which the IMF estimates could boost global GDP by 0.5% annually from 2025-2030. However, these gains are uneven. Developed countries, with stronger infrastructure and tech capabilities, experience greater productivity and growth, while developing nations often lag due to limited digital resources. This gap highlights the need for investment and policies to ensure AI’s benefits reach both developed and developing economies, tying directly into how AI influences labor productivity and GDP growth worldwide.

Since its launch in late 2022, ChatGPT has rapidly evolved from a novel AI chatbot to a transformative tool impacting industries worldwide. Within months, it reached over 100 million users, becoming one of the fastest-growing consumer applications ever. Its capabilities have expanded across sectors—from education to business productivity—automating tasks, improving efficiency, and reshaping workflows. This exponential growth is expected to continue as AI models like ChatGPT become more integrated into daily operations, driving labor productivity and contributing to GDP growth, especially in developed nations with advanced digital ecosystems. However, the rapid pace of development leaves the future of AI uncertain, raising questions about job displacement, regulation, and global equity. While developed countries reap immediate benefits, developing nations risk falling further behind without proper infrastructure and policies. This highlights a key theme in AI’s role in shaping labor markets and economic growth across different regions.