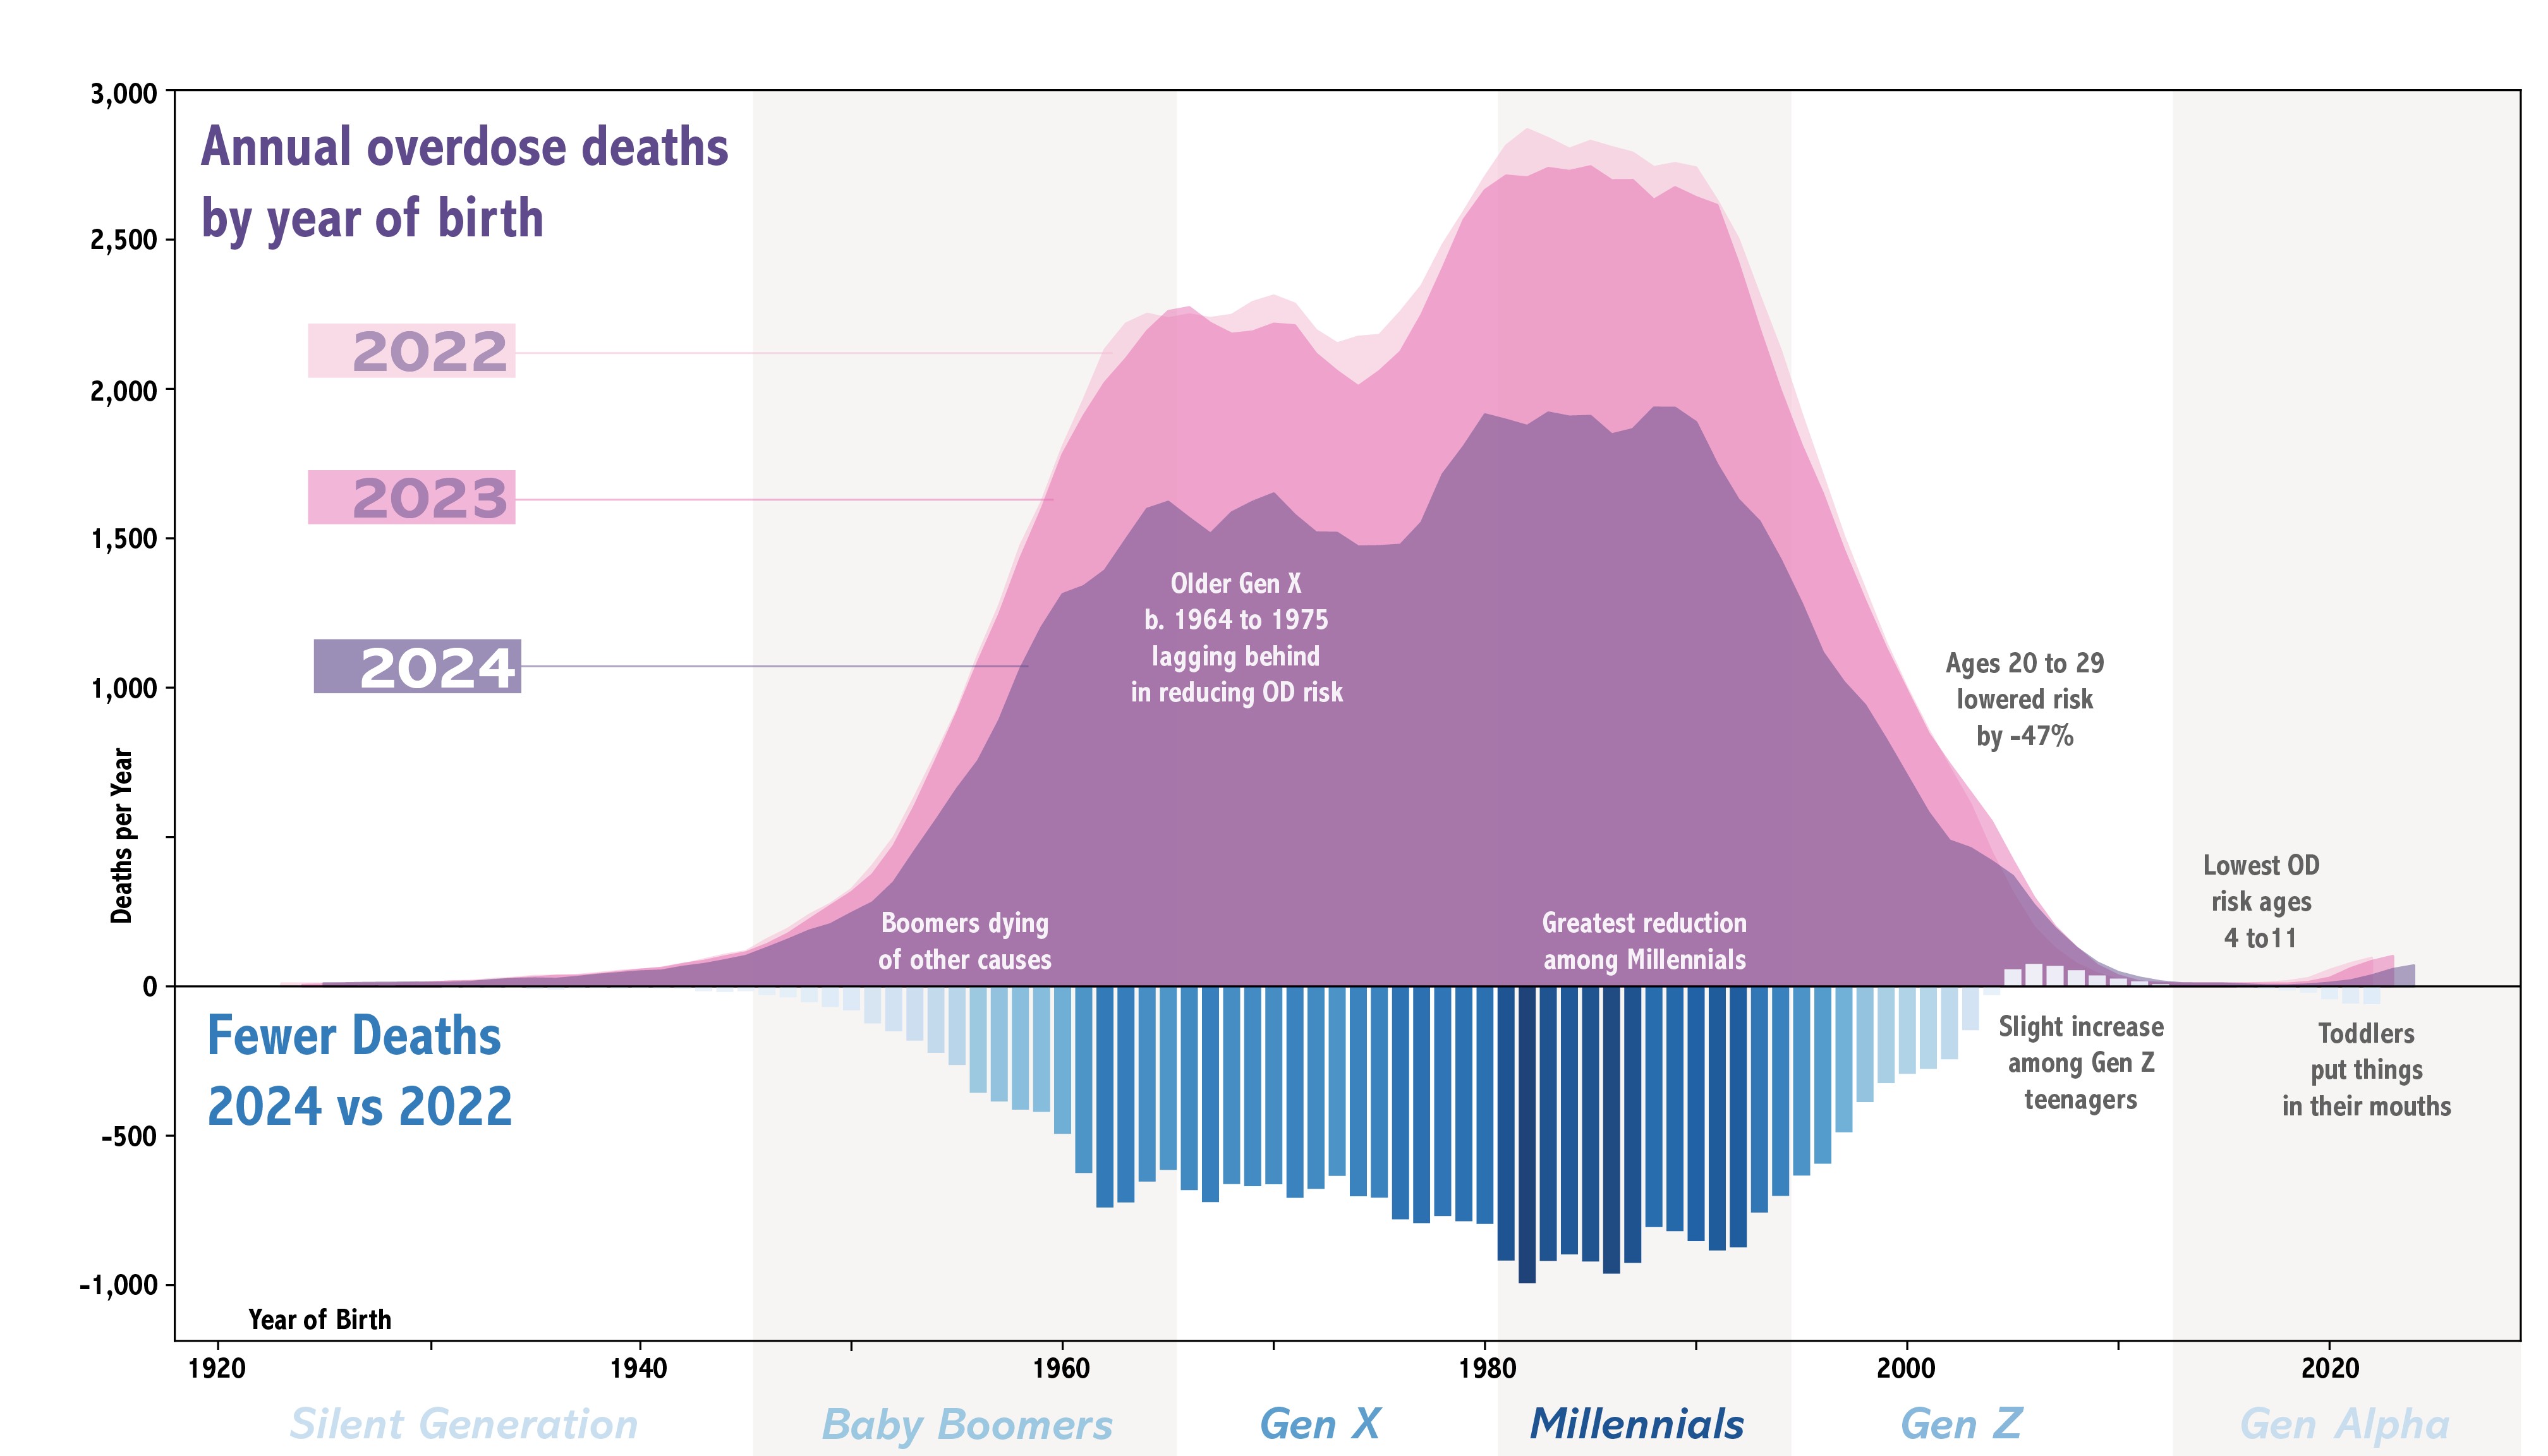
Generational Relevance of Recent Overdose Reductions
This notebook walks through analysis of changes in overdose deaths between 2022 and 2024. Deaths are analyzed by year of birth to see if generational effects are evident in the reduction in overdose. This notebook allows you to reproduce the entire analysis and generate the figure. You can skip the code boxes if you wish, or if you use a different coding language follow the # green comments to see what was done step-by-step.
Notebook created by Nabarun Dasgupta @ UNC Opioid Data Lab (nab@unc.edu) on May 28-9, 2025
Written in Python 3.10 for Data Science
We have 3 data limitations to contend with.
Data Import
Load month x age-at-death from WONDER. Specifications below:
Dataset: Provisional Mortality Statistics, 2018 through Last Week Query Parameters: UCD - Drug/Alcohol Induced Causes: Drug poisonings (overdose) Unintentional (X40-X44); Drug poisonings (overdose) Suicide (X60-X64); Drug poisonings (overdose) Homicide (X85); Drug poisonings (overdose) Undetermined (Y10-Y14) Year/Month: 2022; 2023; 2024 (provisional) Group By: Single-Year Ages; Month Show Totals: Disabled Show Zero Values: True Show Suppressed: True Calculate Rates Per: 100,000 Rate Options: Default intercensal populations for years 2001-2009 (except Infant Age Groups) --- Help: See http://wonder.cdc.gov/wonder/help/mcd-provisional.html for more information. --- Query Date: May 28, 2025 7:57:26 PM --- Suggested Citation: Centers for Disease Control and Prevention, National Center for Health Statistics. National Vital Statistics System, Provisional Mortality on CDC WONDER Online Database. Data are from the final Multiple Cause of Death Files, 2018-2023, and from provisional data for years 2024 and later, as compiled from data provided by the 57 vital statistics jurisdictions through the Vital Statistics Cooperative Program. Accessed at http://wonder.cdc.gov/mcd-icd10-provisional.html on May 28, 2025 7:57:26 PM
The original CSV for analysis can be downloaded from the block below, using the arrow in the bottom right corner.
File and dataframe names:
Handle suppressed values via backfill
Load annual counts to backfill suppressed values in monthly counts, with assumption of uniform distribution. Suppression happens if call count is between 1 and 9 cases. So we will assume n=5 for backfilling because it is the midpoint of the suppressed range (1-9).
We wouldn't have to do this if we could just get actual line-level data from CDC. We need easier, faster data access to answer our questions! Anybody know any government efficiency experts, ha.
These are the final confirmed death counts for 2022 and 2023, as close to "truth" as we can get within the national mortality data system.
Handle incomplete or provisional for 2024
As Kastalia Medrano at Filter points out, the NVSS predicted total is usually an overcount by a few thousand. We can see this in 2023 data, which confirmed count is 105,070 whereas it had been predicted to be 110,037, or 4.72%. For 2024, the corresponding predicted is 80,391, but the confirmed cases are 71,903 as of this data analysis on May 28, 2025. Part of this discrepancy is due to pending death investigations.
CDC NCSS notes: "Relative to final data, 12-month ending provisional counts of drug overdose deaths for 2023 were 95% to 96.9% complete after a 4-month lag."
We are now just beyond that 4-month lag.
But this is confusing. One process leads to a 4.72% overestimate, and ones process leads to a 3.1-5.0% underestimate. Which do we adjust for will depend on which data source we want to visualize, the predicted-smoothed or the actuals, respectively. I think actuals.
It's important to note that on the absolute scale there the same order of magnitude fewer deaths, which is what we are really trying to get at in this analysis:
But this exaggerates the decline because some investigations are still pending. So we can inflate 71,903 suppression-removed confirmed cases up to account for this. CA, TX, NY had the biggest declines in 2024 on the absolute scale (see our post about this), so let's average the 4-month reported (in)complete table from 2023 for these 3 states: 95.9%, 97.3%, 94.3%, respectively. So that 4.2% incomplete on average. This method is better on the absolute scale than taking the average of all states, because smaller states who get their autopsies done quicker would shrink the adjustment.
Putting it all together, 71,903 * 4.2% = 74,922 deaths we predict in 2024.
We are going to move ahead with this adjusted figure to get to the heart of the analysis. We will call this our "adjusted" analysis. This is our target total count for 2024 (also known as a marginal sum), and we want to adjust the ageyear-level data accordingly to account for the higher incomplete cases in the last 4 months of the year. We don't have any reason to assume linearity, and in fact our experience tells us this is not linear, so we will fit a quadratic decay to distribute the balance across ages and months to reach the marginal sum.
Makes assumption of uniform birth distribution throughout the calendar year. YOB may be off by plus or minus 6 months for half the population for any given individual, but should be about correct on average.
Year of Birth
Absolute differences between 2024 vs. 2022 (negative means higher in 2022), before smoothing:
Generations
save plt as editable PDF
Zooming in on Gen Z
From here, the final annotated figure was created using Adobe Illustrator 2025, based on the PDF export of the plot
Plotting as age at death instead of generation as a double check on what that format does for inference
Differences 2024 vs. 2022 by age decade
Same Data, Better Graphs
Note that these are adjusted estimates based on correcting for data suppression rules and pending autopsies (described above). Therefore the numbers in each row are estimates.
Differences 2024 vs. 2023 by age decade
Note that these are adjusted estimates based on correcting for data suppression rules and pending autopsies (described above). Therefore the numbers in each row are estimates. Counts in the youngest decile and oldest 2 deciles (less than 500 deaths) are more likely to be influenced by random rounding error.
Proof Table - Categorizing the Continuous
The implications of categorizing continuous age in 5-year increments obscures a birth-year effect. Between 2024 and 2022, OD deaths increased for those born from 2005 to 2011 (pink & red cells in Deaths Difference column). Kids born in 2008-2009 (red cells) would have been in age group 10-to-14 in 2022, but were 15 or 16 in 2024 at time of death, putting them in age group 15-to-19 (yellow cells).
Looking at the Deaths Difference column we can see the impact of the age-group boundary: An increase (+16) among those born in 2009 is swamped out by a large decrease (-175) among those born in 2003, as the yellow age-group boxes in the table shift downwards. Hence, older Gen Z seems to have adopted strongly protective behaviors against overdose, whereas we cannot say the same for younger Gen Z where ODs increased.
Put another way, putting people into 5-year bins while doing a 2 year comparison = When we use age-group comparisons over time, what we are actually saying is "What would be the difference in ODs if everyone stayed the same age between 2022 and 2024?" This is like measuring the depth of a river from a fixed dock, versus measuring from the deck of a boat moving down the river.