Analysis of products and their cost
Run to view results
The graphs and analysis are based on the sale of products and their cost per color to identify the most profitable color.
Run to view results
Run to view results
Run to view results
The number of products by style shows the highest number of sales in NAN products, they must be categorized to be more precise in the statistics. However, product U is the most consumed by users.
Run to view results
The product line also indicates that 20% is the most consumed by users, maintaining a margin of 45% unknown due to lack of categorization.
Run to view results
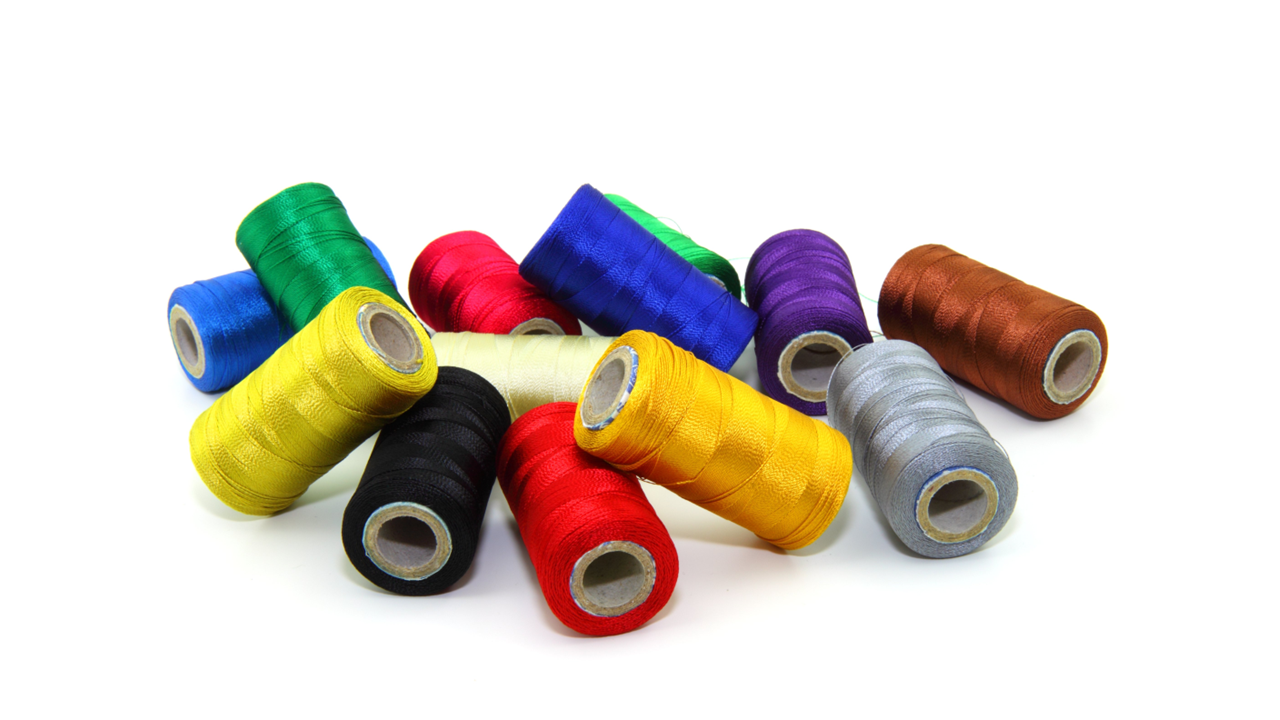
The scale of the best-selling colors that generate the highest income are black, red, silver and yellow.
Run to view results
Run to view results