PokéInsight: Type Dominance in Generation 1

Note: Click the "Run" button to load my project!
🎯 Goal
The primary goal of this project is to build an end-to-end ETL pipeline — extracting, transforming, and loading real Pokémon data from the PokéAPI.
🧩 Core Data Questions
What Pokemon types are the strongest in Gen 1?
What Pokemon types are the weakest in Gen 1?
👣 Steps:
1. Ill extract data from the PokéAPI using the first 151 endpoints corresponding to Generation 1 Pokémon. After extraction, Ill clean the data, select key features, and convert it into a DataFrame for easier analysis.
2. I'll proceed to transform the data using SQL to filter and identify missing values, ensuring data hygiene. I'll also calculate key metrics and reshape the dataset as needed for analysis.
3. Time permitting, Ill proceed with data visualizations to answer the 2 core questions.
Project
Run to view results
Run to view results
Overview of Data Statistics
From the description of the data frame below, we can take note of a couple of factors.
Run to view results
The average HP is around 64, indicating that most Pokémon have moderate health and aren’t particularly tanky. However, the maximum HP value of 250 suggests the presence of an outlier (likely Chansey), while the minimum HP value of 1 points to a potential low-end outlier. These extremes highlight that although most Pokémon cluster near the mean, a few significantly deviate from it.
The average Attack is roughly 73, showing that Pokémon in Gen 1 are generally balanced between offense and defense. This suggests that Generation 1 Pokémon weren’t overwhelmingly attack-heavy overall.
Upon viewing stat distributions, most Pokémon attributes (HP, Attack, Defense, etc.) appear right-skewed, meaning a small number of Pokémon have exceptionally high values that raise the overall average. This suggests that while most Pokémon are balanced or moderate, a few strong ones dominate the upper range. For example, Charizard and Blastoise likely fall into this “tail” region. Height and weight are also heavily right-skewed, which makes sense biologically — most Pokémon are small, with only a few being unusually large for Gen 1 Pokemon.
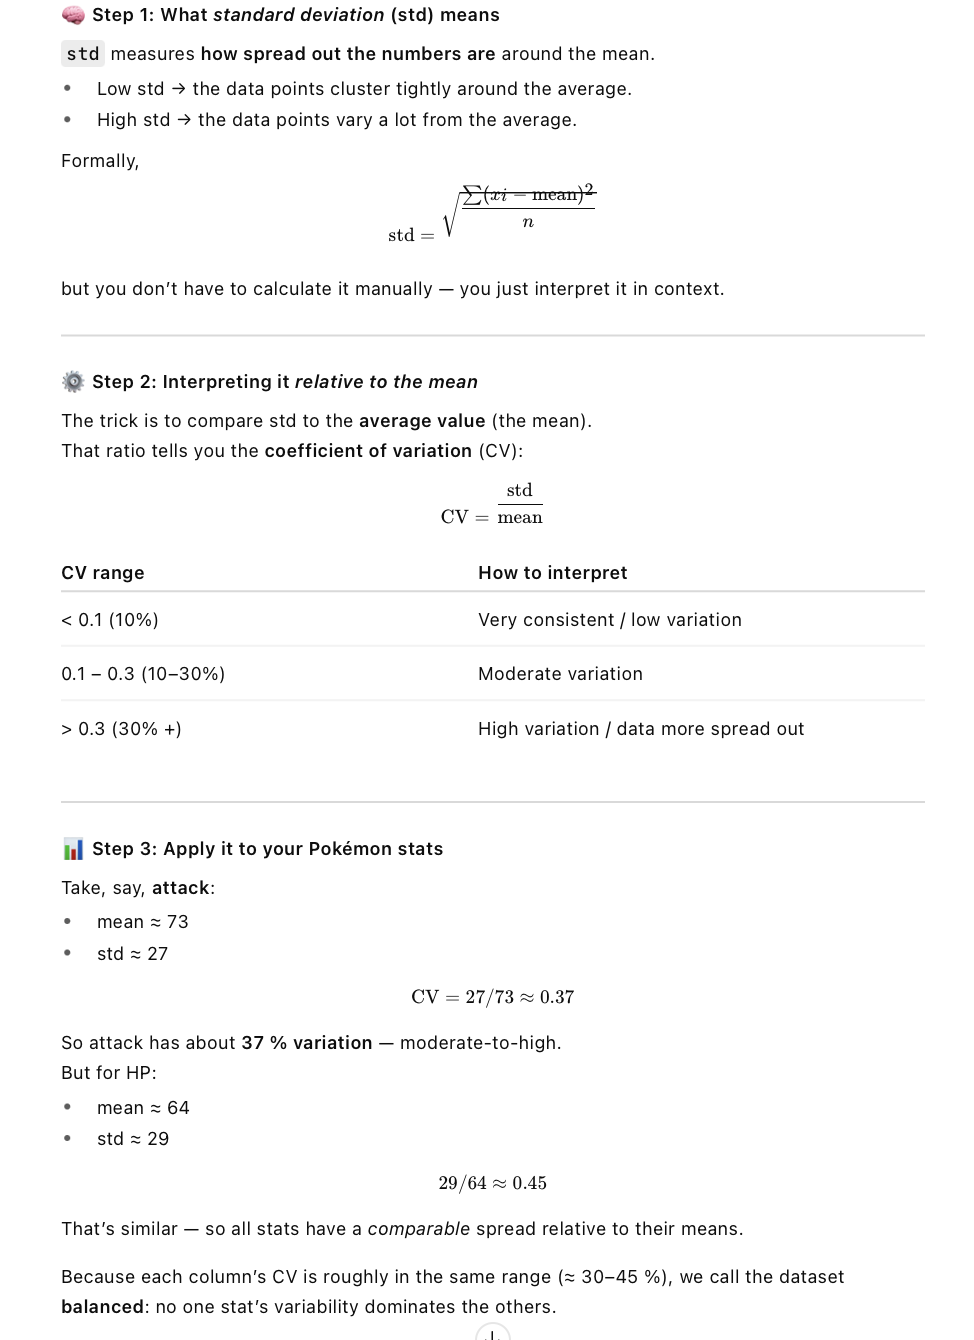
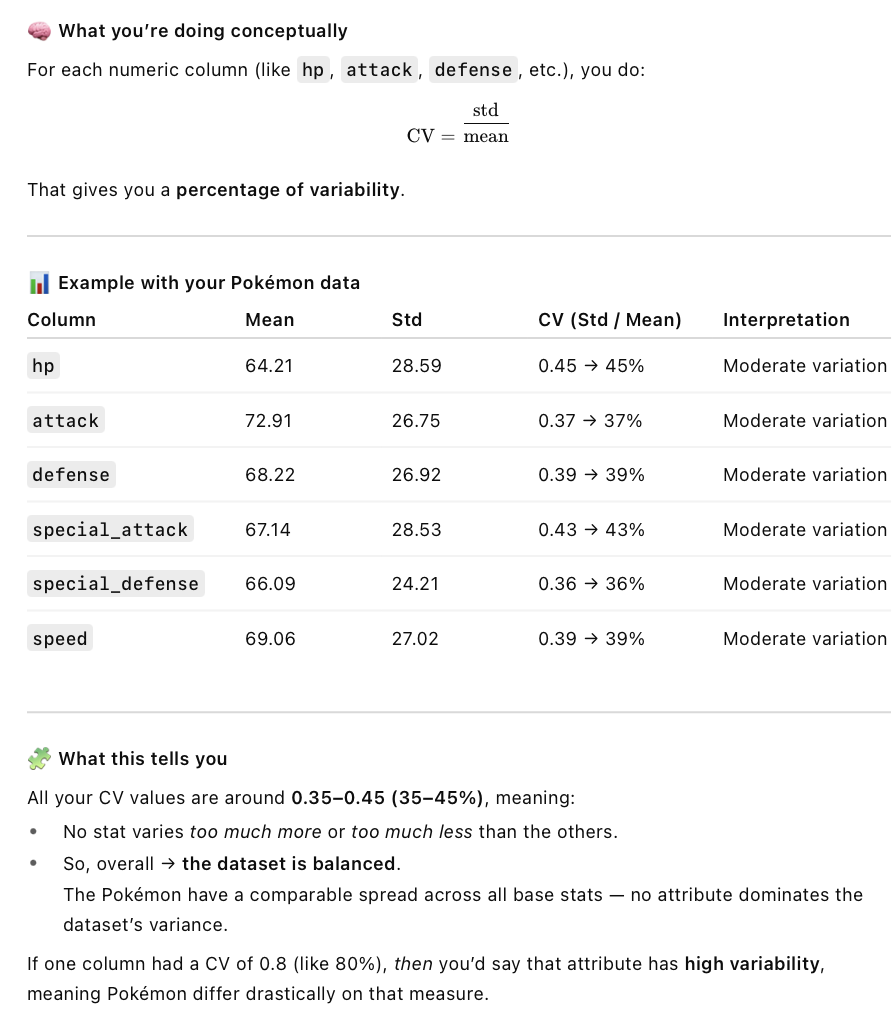
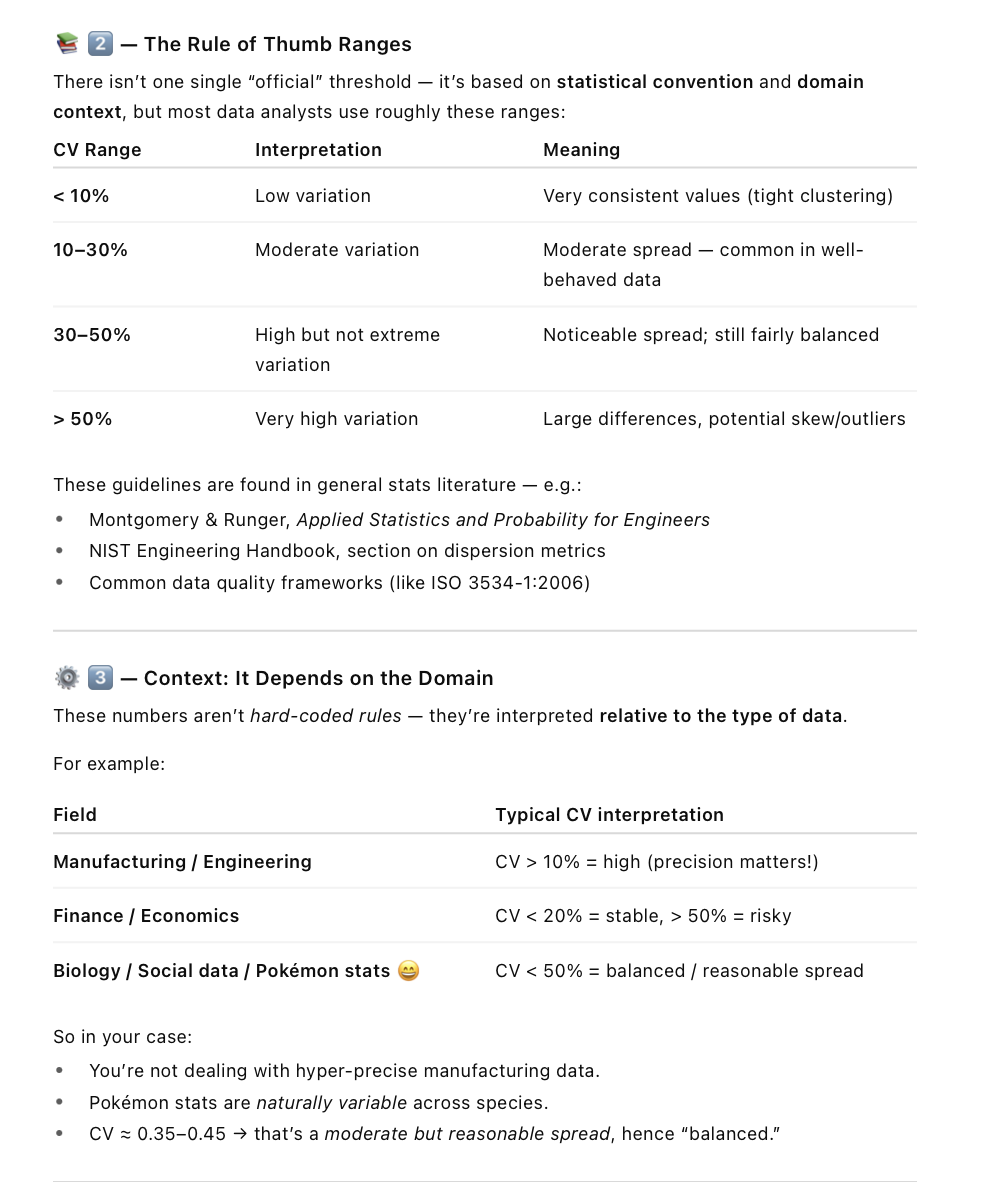
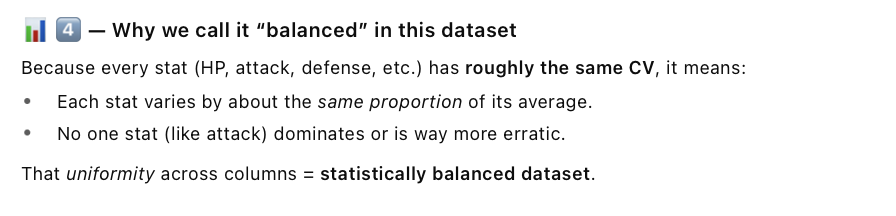
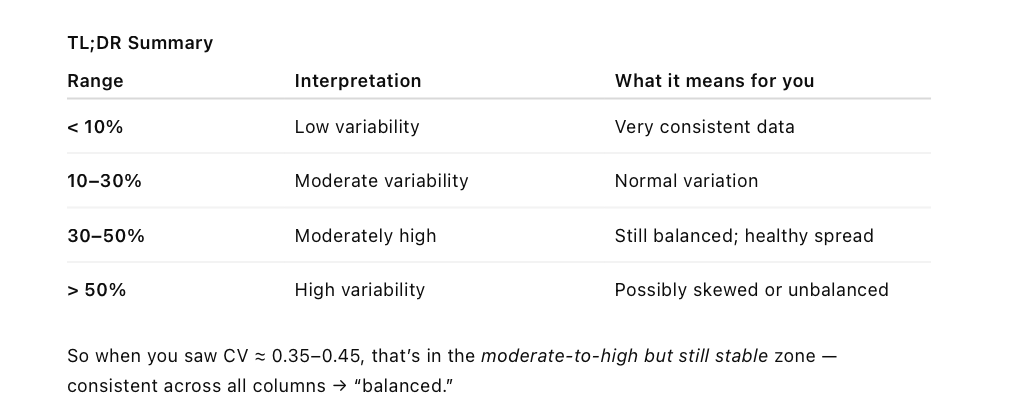
Another important metric to consider is the Coefficient of Variation (CV), which measures the relative variability of each attribute. All CV values across the dataset fall between 35% and 45%, indicating a fairly balanced spread. I calculate this value by dividing the standard deviation by the mean, providing a percentage that represents variability relative to the mean.This suggests that Pokémon base stats have a comparable degree of spread, with no single attribute dominating the dataset’s variance. This balance is valuable to note for future model development, as it reduces the risk of an algorithm over- or under-weighting certain features due to skewed distributions.
Run to view results
Furthermore, when the dataset is balance, the model sees all classes equally, so it learns the decision boundaries more accurately. This typically reduces bias (since the model doesn’t ignore any group). It can also reduce variance because the model’s predictions become more stable across classes — it’s not overfitting to the dominant one. Hence, this means that balanced data = lower bias and often lower variance → better generalization for the model as a whole!
Reminders:
Bias = how much the model’s predictions deviate from the true pattern (under-fitting).
Variance = how sensitive the model is to fluctuations in training data (overfitting). The goal is to minimize both to get good generalization.
End-to-end pipline = a complete workflow that handles data from its starting point (raw source) all the way to its final destination (usable insight, report, or model) — with every transformation, check, and storage step in between.
Database Setup + E(TL)
Run to view results
Note: Line 36 can be thought of it like saving and closing a Google Doc: you’ve done all your edits (transforms + loads), and hitting “close” ensures your work is safely stored for the next time you open it.
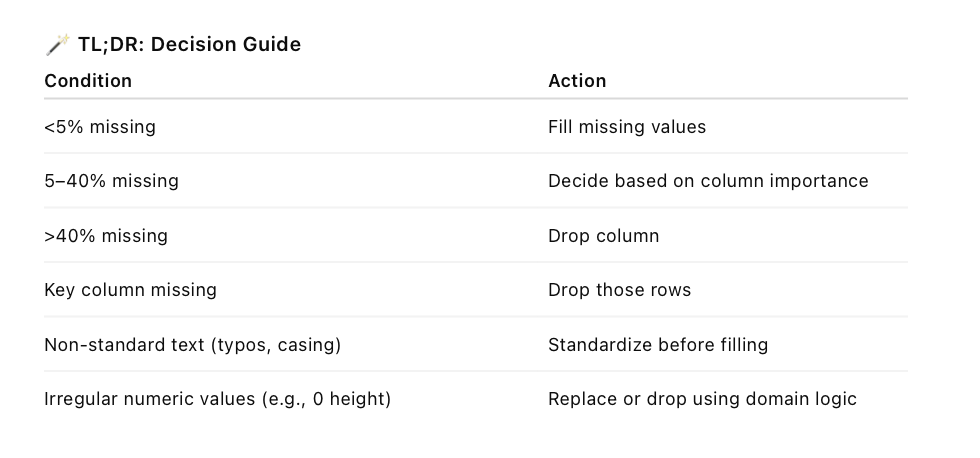
It’s important to take into consideration any NULL values and where they appear in the dataset. We do this to ensure that missing values don’t negatively impact our analysis or modeling. From the output above, most of the NULL values fall under the secondary_type column.
If these missing values were relevant to my analysis, I could address them by:
1. Filling them with a placeholder (e.g., "None" or "Unknown") if the absence of a secondary type is meaningful. The reason for this is due to when you fill a NULL (or NaN) with "None", "Unknown", or even a coded value like 0 or "N/A", you’re telling the computer, “this isn’t missing by mistake — it’s intentionally blank. Filling it clarifies that “this Pokémon only has one type,” instead of implying the data is incomplete or erroneous.
2. Imputing them based on similar Pokémon (e.g., same primary_type) if it helps preserve structure.
3. Dropping rows only if they’re few and don’t affect data integrity.
However, for my current purpose — identifying the strongest and weakest Pokémon — these NULL values aren’t a concern, since I’m focusing on combat stats rather than type completeness.
Time Permitting ✨
The focus of this project was to build an ETL pipeline from start to finish. However, time permitting, I would begin with graphic visualizations of the data to reveal patterns that may not be present by analyzing the data in a tabular format. Furthermore, I would explore correlations between base stats and Pokémon types, visualize outliers across attributes like height and weight, and build comparative plots (such as boxplots or heatmaps) to better illustrate which types consistently dominate in different stat categories.
--
Other Notes
Correlation Coefficient Reminders:
Reshaping Data: means changing the structure or layout of your dataset — without necessarily changing the data values themselves. It’s about organizing the same information in a way that makes it easier to analyze, visualize, or feed into a model.