Big number blocks
Important metrics deserve a big number
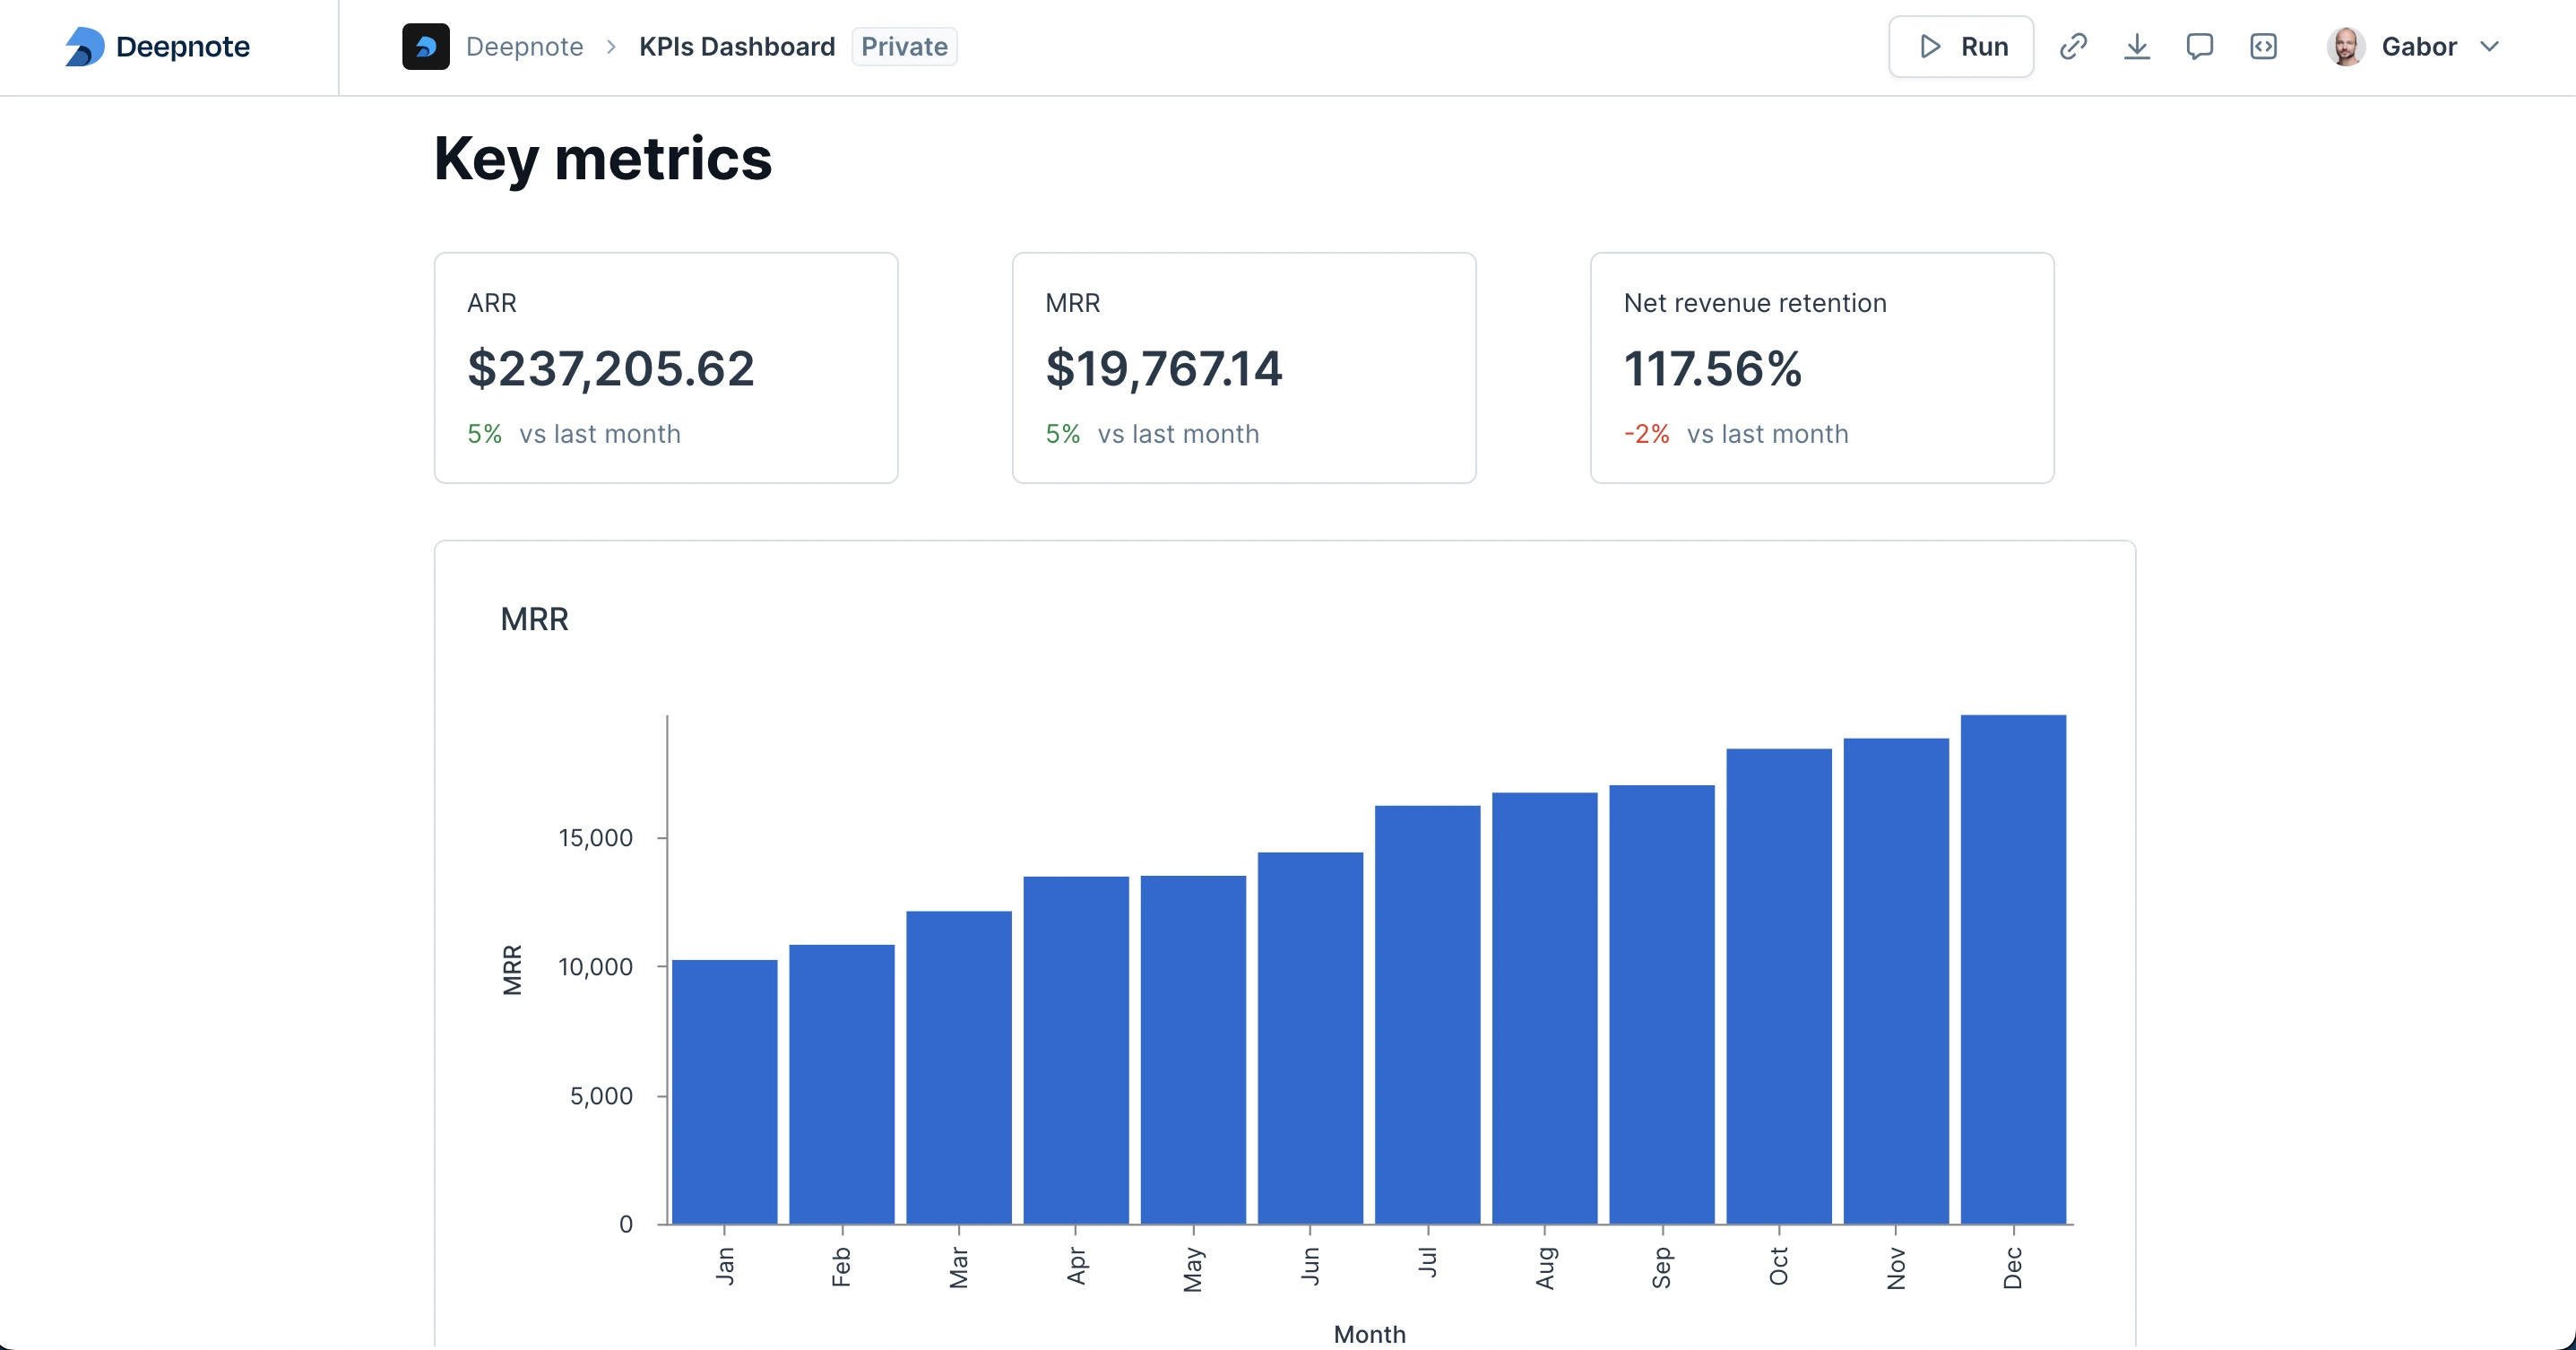
We all love a good bar chart or a scatter plot — they're great for deep dives into data. But sometimes, you need to cut to the chase and highlight a single, crucial metric for your stakeholders. That's where our big number chart comes in. It's the simplest way to put your most essential numbers front and center in your apps and dashboards.
You can add a big number block by pressing the add block (+) button between blocks and selecting the "Big number" option from the menu.
The title block supports interpolating Python variables using Jinja-style brackets. For example: "Sales in {{month}}".
You can choose any variable available inside the notebook for the value you want to display.
The big number chart has different formatting options, including:
- Number
- Currency
- Percent
- Scientific
- Financial
Comparisons
If you want to show progress or change over time, you can also add a comparison to visualize how this number differs from a previous value, making trends instantly noticeable.
There are a few different ways to do the comparison:
- Absolute change: The difference between the current and previous values.
- Percentage change: The percentage difference between the current and previous values.
- Absolute value: The current value compared to a fixed reference value.